The post ANSI/AAMI ST108 Summary: Water for the Processing of Medical Devices appeared first on ChemTreat, Inc..
]]>ANSI/AAMI ST108 Water for the processing of medical devices was approved on August 16, 2023. This standard replaced the Technical Information Report 34. Unlike the Technical Information Report, the updated standard provides clear requirements for every stage of medical device processing. ANSI/AAMI ST108 establishes minimum requirements for water quality and steam purity for processing medical devices intended for patient use. Proper implementation of this standard improves the effectiveness and lifespan of equipment, such as ultrasonic sterilizers, endoscope reprocessors, autoclaves, and local steam generators. Implementing this standard involves a comprehensive process, starting with an assessment of current water quality management practices.
Standard Applicability
The applicability of ANSI/AAMI ST108 applies to facilities that have medical device processing equipment (cleaning, rinsing, disinfection, and sterilization). Criteria includes the considerations listed below.
Water is categorized into three different types based on the disinfection characteristics or sterilization process type.
a. Utility water is tap water that is used for rinsing, flushing, and intermediate rinsing (rinsing between cleaning and disinfection). This water may require treatment.
b. Critical water is final rinse water that has been processed by highlevel disinfection. To meet the water quality requirements, critical water requires an extensive multi-step treatment process. This process can include pretreatment, storage, distribution, and final treatment.
c. Steam is considered vaporized water produced by a centralized boiler near the sterilizer(s). Steam is tested as condensate, following the sterilizer.
A multidisciplinary team must be established and should have knowledge of the water systems and associated processes in use. Team members should include facilities engineering staff, infection prevention, medical device processing personnel, clinical engineering staff, and water treatment specialists.
A risk analysis should be performed to evaluate and identify risks associated with utility water, critical water, and steam. The following water characteristics should be considered: physical appearance, microbial concentrations, inorganic/organic contaminants, pH, conductivity, and temperature.
Routine monitoring and performance qualification testing is essential to maintaining the integrity of the water treatment systems. The updated standard provides detailed guidance on water quality testing standards, testing frequency, and system functionality. Monitoring is performed by the multidisciplinary team. The team reviews the water quality results and implements the necessary corrective actions if the results are out of range. The standard includes reference tables that specify testing parameters and frequencies.
The new standard provides guidance on water treatment system installation, operation qualification, and design of water treatment systems. It also provides recommendations on service interruptions, system shutdowns, and construction related activities.
The standard serves as a framework for facilities to create an impact on water quality and patient safety. Proper implementation of this standard can help prevent issues such as, medical device and processing equipment damage, processing inefficiencies, and negative patient outcomes from surgical site infections.
To access the standard, go to: https://www.aami.org
Download the PDFThe post ANSI/AAMI ST108 Summary: Water for the Processing of Medical Devices appeared first on ChemTreat, Inc..
]]>The post Direct-to-Chip Liquid Cooling Treatment Helps DOE National Laboratory Improve System Performance appeared first on ChemTreat, Inc..
]]>National laboratories managed by the Department of Energy (DOE) often have extensive direct-to-chip liquid cooling and high-performance computing (HPC) systems that need to operate at peak efficiency to meet critical research goals. These facilities require a variety of customized water treatment solutions to maintain operating efficiency and preserve their assets.
One national laboratory in the Southern United States was struggling with performance issues in its open recirculating, closed loop, and HPC cooling systems. As a preferred water treatment consultant to the DOE, ChemTreat employed state-of-the-art technologies and provided technical and analytical support to address the lab’s needs.
Improving Cooling System Performance
Addressing Inefficiencies in Open Recirculating Cooling Towers
Project Description
The laboratory operates several large open recirculating water systems responsible for cooling critical research equipment and data center HPCs. These systems were fouled with mineral deposits that significantly impacted heat transfer and cooling efficiencies and contributed to increased metal corrosion and microbiological activity.
Solution
To address these issues, ChemTreat’s Research & Development team developed a treatment solution using Quadrasperse® polymeric dispersant and corrosion inhibition technologies, specifically designed to meet the unique needs of this facility.
Results
After applying our custom-designed treatment program, mineral deposits were removed from the cooling tower fill and heat exchanger surfaces, significantly improving heat transfer efficiency and reducing the risk of underdeposit corrosion and microbiological activity.
Enhancing HPC Cooling Performance
Project Description
The facility has many computer applications with direct-to-chip liquid cooling, including a large, recently built HPC that was unable to pass speed testing because of poor cooling performance.
The HPC’s cooling loops had become heavily fouled with biological growth, mineral scale, and other additives, preventing the unit from reaching the maximum expected calculations per second that it was designed to achieve.
Traditional cooling treatment methods add film inhibitors, such as silicates, to control corrosion, and biocides to mitigate microbiological issues. However, direct-to-chip liquid cooling systems have slightly different needs.
Solution
ChemTreat developed CL2001, a product specifically designed for CPU applications, to treat the laboratory’s HPC cooling loops. This treatment methodology takes a more holistic approach, avoiding inhibitors that can cause fouling while implementing a proprietary protocol to control corrosion and microbiological activity.
Results
The CPU cooling at the site has been optimized with CL2001 treatment, and the HPC has passed the speed test. Stress testing is ongoing, and the laboratory is expected to accept ownership of the HPC from the manufacturer in the coming months.
Addressing Fouling and Corrosion in Aluminum Closed Loop Cooling Systems
Project Description
The closed loop system was experiencing fouling events that led to underdeposit corrosion in aluminum equipment, reducing heat transfer efficiency.
Solution
The facility began using ChemTreat’s patented FlexPro® multi-metal corrosion inhibitor specifically designed for aluminum applications. The new inhibitor has a neutral pH, allowing the cooling systems to operate within an acceptable pH range.
Results
Thanks to the application of the patented FlexPro corrosion inhibitor, the chilled water loop is now free from suspended solids caused by corrosion byproducts. The water clarity is excellent, and heat transfer and cooling efficiency have improved greatly. Aluminum corrosion has been reduced from >10 mpy to <0.1 mpy.
Value-Added Water Conservation Project
In addition to treating the issues experienced by the laboratory’s closed loop cooling systems, ChemTreat implemented a program to help the facility meet environmental goals.
Utilizing a proprietary, state-of-the-art aluminum corrosion inhibitor, ChemTreat assisted the laboratory with a once-through to closed loop cooling water conservation project, saving 34 million gallons of water per year while protecting critical research equipment.
Conclusion
ChemTreat’s water treatment expertise and custom solutions helped a national laboratory improve the efficiency of its direct-to-chip liquid cooling and other cooling systems.
The results of this partnership have yielded the following benefits for the facility:
- Cooling tower systems have remained free of mineral deposits and have exhibited excellent corrosion and microbiological control for more than a decade.
- Improvements to CPU cooling treatment helped the facility’s HPC pass the speed test.
- Aluminum corrosion reduction in the closed loop improved water quality and heat transfer efficiency.
- A water conservation project in the closed loop cooling system helped the laboratory save 34 million gallons of water annually.
Results are examples only. They are not guaranteed. Actual results may vary.
The post Direct-to-Chip Liquid Cooling Treatment Helps DOE National Laboratory Improve System Performance appeared first on ChemTreat, Inc..
]]>The post RO Makeup Water Sources: Addressing Variable Water Quality to Maintain System Efficiency appeared first on ChemTreat, Inc..
]]>This article discusses the characteristics of various makeup sources and outlines processes for analyzing RO makeup water.
Read on to:
- Examine the various types of makeup water sources.
- Explore the impact of minerals, organics, microbiological growth, and other constituents on RO systems.
- Learn some best practices for maintaining RO system efficiency.
Makeup Water Sources: Where is the Water Coming From?
To understand the potential vulnerabilities of an RO system, it is important to know its makeup water source.
RO manufacturers typically suggest cleaning systems every 3–4 months; yet, in many cases, RO systems require more frequent cleanings. This is, in part, because of the differences in water coming from varying makeup sources, and more importantly, the performance of the upstream filtration equipment. Pretreatment is a key component of reliable and efficient RO.
Makeup water quality is very important. Any imperfections in the water can lead to fouling, scaling, and corrosion if not treated properly.
Surface Water
Surface water is drawn from sources such as:
- Rivers
- Lakes
- Reservoirs
- Canals
Typically, all surface waters contain fluctuating levels of suspended and colloidal particles, organics, microbiological activity, and turbidity. If the makeup source is a river, for example, the clarity or turbidity will change based on rainfall and land runoff.
Surface water contains suspended and colloidal particles, which will pass through a 5-micron cartridge filter in the RO, increasing pressure changes (ΔP). This can result in RO fouling during the first stage. Conducting a Particle Size Analysis of the makeup water and the outlet of the cartridge filter housing is recommended at this stage.
Well Water
Another source for makeup is well water.
- Shallow wells are typically located anywhere from 40 to 150 feet below the surface.
- Deep wells can be found anywhere from 600 to 1,000 feet below the surface.
Generally, the deeper the well, the cleaner the water. Deep wells have more consistent temperatures, and water pulled from these wells often contains lower levels of bacteria, colloidals, organics, and suspended particles.
Gray Water
Gray water typically refers to tertiary wastewater intended for municipal and industrial reuse.
In recent years, water scarcity has made gray water a more popular source for makeup. Instead of using surface water, many municipalities now use gray water from power plants, chemical plants, and refineries for their processes.
Although gray water use has gained in popularity, it comes with unique treatment challenges. Gray water typically has a large amount of organic loading, ammonia, and phosphates, while its low chlorine residual is rarely sufficient for removing microbio.
How to Maintain RO Efficiency with Makeup Water Analysis
Silt density index (SDI) testing is a best practice for analyzing RO makeup, as it measures the fouling capacity of the water used in the RO.
SDI testing is performed on site with an SDI kit. The test requires a constant makeup stream at 30 psi. This stream is passed through a 0.45-micron filter pad at a known volume for 15 minutes to calculate SDI.
Typically, RO manufacturers recommend an SDI of 5 or below, but many are now indicating that 3 or less is needed for good RO performance.
In most cases, the lower the SDI, the better the system will run. It is a good idea to save the SDI pads for historical reference.
Upstream Chemical Addition to Surface Water Makeup
Utilizing surface water as a makeup source requires facilities to implement either a clarification process to remove turbidity or a cold lime softening process to reduce hardness, alkalinity, and turbidity.
Regardless of which process is implemented, treatment will include coagulant and/or flocculant chemicals.
Coagulants
Coagulants have one of three bases:
- Aluminum
- Iron
- Organic
The amount of coagulant fed to the system greatly varies based on the surface water source.
A good example of this is the Mississippi River, which flows north to south. At the top of the river in Minnesota, the turbidity level of the water is low, so coagulant feed will be in a low parts per million (ppm) range.
As it moves south, the Mississippi meets the Missouri, Illinois, and Ohio rivers. These confluences lead to turbidity formation, so water treatment plants along the river feed higher amounts of coagulant into their system to adjust for higher turbidity.
Flocculants
Flocculants also play an important role in turbidity reduction. They can be cationic, anionic, or non-ionically charged. Flocculants are typically dosed at less than 2 ppm, so it is important to monitor how flocculants are being added to your system.
The Challenges of Coagulant and Flocculant Treatment
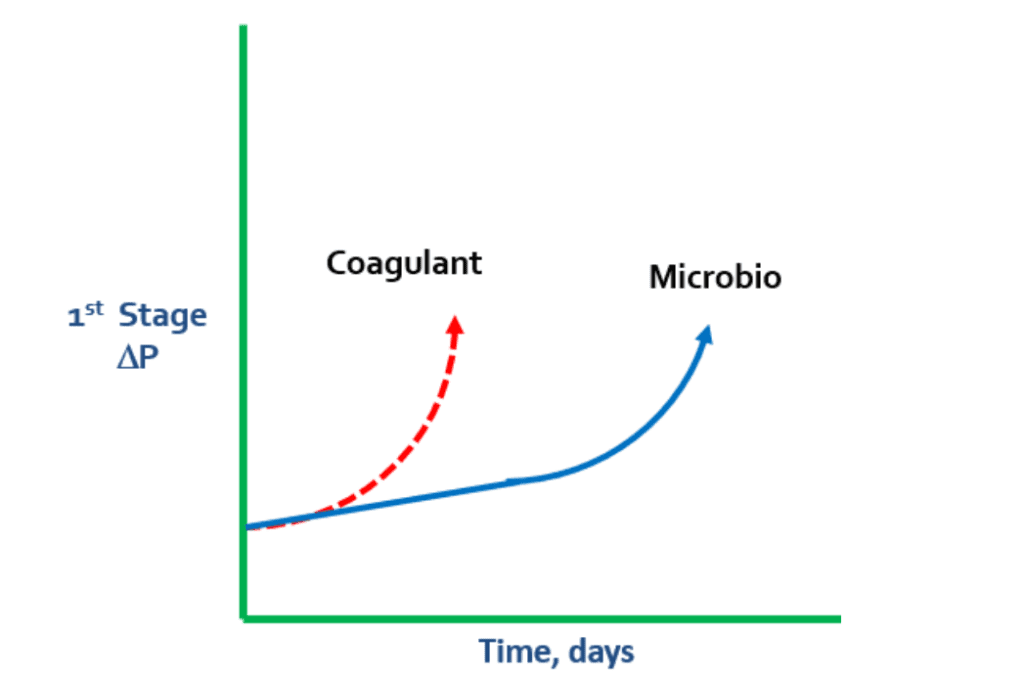
Though coagulants and flocculants are beneficial for producing the desired finished water quality, they can still be detrimental to overall RO membrane health.
Unlike the slightly negatively charged RO membranes, coagulants are cationically charged, which can cause pressure changes. If there is a rapid spike in ΔP during the first stage, it is prudent to look for a coagulant problem. Coagulant levels may not have been adjusted to match changes in turbidity, which can result in coagulant overfeed.
In these cases, coagulant begins to lay down on the membrane and grab microbio, particles, and colloidals. When the negatively charged bacteria meets the positively charged coagulant, the coagulant continues to grab more and more microbio.
In some cases, extreme levels of polysaccharides in microbio can cause a “flypaper” effect, which leads to microbiological matter grabbing suspended solids and colloidals from the water. This can result in membrane fouling.
If the RO membrane is not cleaned properly, coagulant issues can lead to gap formation.
Once gaps form inside an RO membrane, they are very difficult to remove. Therefore, it is important to monitor microbio levels within the makeup water as it enters the system.
Additionally, if a plant is using city water for makeup, it is recommended that facility personnel contact the municipality and ask what type of coagulant has been used upstream.
The Impact of Minerals on Makeup Water
It is also important to be aware of the mineral contents of makeup water.
Minerals can be broken down into two separate subgroups: cations and anions.
Examples of each are included below:
| Cations | Anions |
|---|---|
| Calcium | Total Alkalinity |
| Magnesium | Chlorides |
| Sodium | Sulfates |
| Potassium | Nitrates |
| Barium | Fluoride |
| Strontium | Orthophosphate |
| Aluminum | Silica |
| Iron | |
| Manganese |
Testing makeup water for mineral content is an essential step in determining the type of RO antiscalant to use and the percent RO recovery rate.
Of the cations, barium, aluminum, iron, and manganese are particularly important to monitor. Levels of each should typically not exceed 0.05 ppm (50 ppb).
Aluminum can be especially problematic. It is typically fed as a coagulant to reduce turbidity, but excess aluminum can lead to RO fouling, which can be difficult to treat with an antiscalant.
The following anions: total alkalinity, orthophosphate, fluoride, and silica, may also need to be monitored closely. Gray water is particularly prone to supplying excess phosphates.
The recommended testing frequency for minerals in makeup is:
- Every other month for surface water sources
- Quarterly for well water
- Monthly for gray water
In general, calcium phosphate, calcium sulfate, and barium sulfate can all be treated with an antiscalant, while aluminum, iron, and manganese may be a bit more difficult treat.
Other Important Testing Parameters
pH
Once the pH and total alkalinity are known, the amount of free carbon dioxide (CO2) can be calculated.
Because it is a gas, CO2 passes through the RO membrane, which can lead to pH reduction in the permeate.
Since CO2 is not detected by a conductivity meter, it can flow downstream to the mixed bed and result in a large amount of hidden loading. This could require more frequent replacement of the mixed bed.
Conductivity
Calculating conductivity provides an idea of the number of ions present in the water. For example, high conductivity (300–500 µS) may indicate that hardness and alkalinity levels are within range, but there may still be a high number of chlorides or sulfates in the water. High conductivity may also suggest that more permeate is traveling downstream to the softener or other ion exchange unit.
Total Organic Carbon (Organics)
Surface waters are notorious for having high levels of organic matter, which is measured as total organic carbon (TOC). For RO feedwater, the TOC limit is 3 ppm.
- TOC can be natural or synthetic:
- Natural organics
- Tannin, Lignin, Humic, etc.
- Typically yellowish to brownish in color
- Great source of nutrients for bacteria
- Synthetic organics
- Often coming from farm runoff chemicals
- Can have a greater fouling effect on RO membranes compared to natural organics
- Natural organics
Organics with a molecular weight of 150–200 ppm and higher are rejected by the RO; however, a certain percentage of organics below that molecular weight will pass through the RO into the permeate.
Temperature
Temperature affects the flux rate for permeation. Cooler temperatures cause membrane pores to tighten, decreasing the flux rate. Warmer water loosens up the pores, allowing more total dissolved solids (TDS) or ions to pass through.
Orthophosphates in gray water or calcium in industrial reuse makeup streams can form calcium phosphate (a sludge-like deposit) in the last stage of the RO as the water gets warmer.
The solubility of silica and the flux, on the other hand, decrease as water temperature goes down, and vice versa.
Chlorine
Chlorine degrades RO membranes and needs to be removed either with uncatalyzed sodium bisulfite or an active carbon filtration system. If a transitional metal, such as iron, manganese, or cobalt, is present in a system containing chlorine, the rate of membrane degradation is accelerated.
Often, active carbon beds are paired with a biocide program. The two most commonly used in the industry are DBNPA and isothiazoline. These biocides help alleviate the microbiological activity on the membrane surfaces and the feedwater spacer, where bacteria are easily attached, thus reducing the potential of bacteria entering the system and feeding on the organics.
Chlorine is typically measured with an ORP in-line meter or a chlorine analyzer prior to entering the RO. It is a good practice to wet test for chlorine in addition to using on-line instrumentation.
Turbidity
Turbidity below 0.5 Ntu is a good target for makeup water, but low turbidity does not necessarily indicate the reduction of fouling potential; SDI testing provides more reliable insight.
If it is suspected that colloidal particles are entering the RO, run an SDI pad until it is plugged up and send the pad to the laboratory for a scanning electron microscope analysis. This test will indicate the characteristics of the atomic elements on the SDI pad, providing insight into what is fouling the RO.
Chemical Oxygen Demand (COD)
COD is found in gray water or industrial reuse and can be a major nutrient source for microbio.
A COD range of 8–10 mg/L is a good indication that the makeup source will have low fouling potential from COD.
Microbiological Matter
Two types of bacteria can be present in ROs: aerobic and anaerobic.
Aerobic bacteria
Classified by two types: planktonic and sessile
- Planktonic: free swimming
- Sessile: mature biological slime
Sessile bacteria are developed when aerobic bacteria are allowed to multiply and begin adhering to piping and membrane surfaces. This results in the aforementioned “flypaper” effect.
Best practice is to maintain microbio at 100 Cfu/mL in the feedwater and 1,000 Cfu/mL in the RO reject.
Anaerobic bacteria
- Typically found in ROs using gray or industrial reuse makeup.
- Iron-, denitrifying-, and sulfate-reducing bacteria are strong indications that mature biofilm has fully developed and microbiological control has been compromised.
Gases
Hydrogen Sulfide (H2S)
Normally, H2S is found in wells and is notable for its strong rotten egg odor. If oxidized or exposed to air, H2S can form elemental sulfur in the lead membrane, leading to potential blockage. To maintain system efficiency, the maximum level of H2S in RO feedwater is <0.1 ppm.
Hydrogen sulfide must be tested for on-site.
To test for H2S, fill up a water bottle halfway with makeup water, add a couple drops of hydrochloric acid into the bottle, shake, take the cap off, and smell. If hydrogen sulfide is present in the water, the odor will be apparent.
Carbon Dioxide (CO2)
As previously mentioned, the lower the alkalinity, the higher the CO2 content. Fortunately, CO2 does not play an active role in RO scaling or fouling. It passes directly through into the permeate.
It is important to monitor pH and alkalinity because they provide an indication of how much CO2 is flowing through the RO membrane. High amounts of CO2 can place a large load on the strong base anion and mixed bed.
Ammonia (NH3)
Ammonia is typically found in gray or industrial reuse makeup streams.
At a pH below 8.5, 90% or more of the ammonia is in its ionic form as NH4– and will be rejected in the RO like a monovalent ion. Above pH 9.5, ammonia becomes gaseous.
When mixed with TOC or phosphates, ammonia becomes suitable food for bacteria.
To test for ammonia, grab a water sample, add a few drops of 50% caustic, and shake the sample. If ammonia is present in the water, the strong smell will be apparent.
A Summary of RO Makeup Water Sources and Analysis Techniques
Surface Water
When using surface water for makeup, testing for microbio, organics, suspended solids, and colloidals is recommended. Season changes and shifts in weather conditions can cause rapid fluctuations in the levels of these components, so it is important to test frequently.
Well Water
Though well water quality is generally considered consistent, semi-annual testing is recommended, as it can have high mineral and hydrogen sulfide levels as well as some bacteria.
Gray Water
Various foulants in gray water may cause issues in RO systems, so frequent testing is recommended. It is important to test for bacteria and wash the cartridge filter housing regularly.
The Importance of Testing RO Makeup Water
Regardless of the makeup water source, we recommend trending water chemistry and other constituents and keeping trends on file. This data can assist in troubleshooting if RO problems arise.
As with all technology, due diligence is important to determine the feasibility of utilizing the methods outlined here. Always consult your equipment manuals and seek guidance from your water treatment representative to address plant-specific needs.

The post RO Makeup Water Sources: Addressing Variable Water Quality to Maintain System Efficiency appeared first on ChemTreat, Inc..
]]>The post Minimizing Corrosion and Deposition in High-Pressure, High-Purity Steam Generators for Chemical Processors appeared first on ChemTreat, Inc..
]]>This article provides:
- 1. A basic overview of high-pressure, high-purity steam cycle chemistry for the chemical, petrochemical, and refining industries
- 2. An introduction to the four pillars of steam cycle treatment
- 3. A discussion of typical steam generator issues at chemical processing plants, as well as opportunities for improvement
- a. Anionic and cationic impurities
- b. Corrosion and condensation
- c. Lack of steam quality monitoring and instrumentation
We hope this discussion will help chemical facility personnel improve the long-term production and reliability of their steam systems.
Why Boiler Water Treatment Matters
An Overview of High-Pressure, High-Purity Steam Cycle Chemistry
The primary purpose of boiler water treatment is reducing corrosion throughout the steam cycle.
Treating boilers differs slightly from cooling tower, closed loop, and other chemical system treatment. For instance, true corrosion inhibitors are not added to a boiler system. Instead, aggressive anions like calcium, magnesium, chlorides, sulfates, and silicas are removed.
Oxygen is also removed via mechanical and chemical means.
Higher pH and temperatures stimulate the natural passivation processes that reduce corrosion and emissions, so boiler treatment typically involves raising the pH as well.
The secondary purpose of boiler water treatment is reducing deposition following pretreatment.
Iron and, to a lesser degree, copper deposition is particularly problematic, as it can transport into steam generators and boilers. Iron transported into boilers deposits in high heat flux areas, potentially leading to underdeposit corrosion.
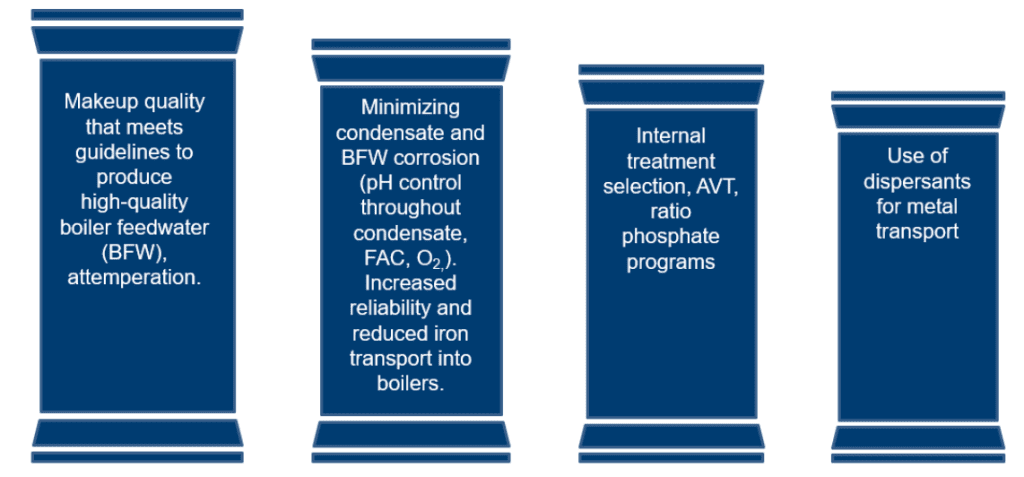
The Four Pillars of Steam Cycle Treatment
The four pillars of steam cycle treatment are a useful tool for understanding boiler treatment and the common gaps seen at chemical processing facilities.
In descending level of importance, the pillars are:
- 1. High-quality feedwater production
- 2. Condensate and corrosion reduction
- 3. Internal treatment selection and AVT
- 4. Dispersant treatment for metal transport
It is important to note that:
- If the first two pillars are addressed with minimal gaps, the second two pillars become less problematic.
- If there are gaps or failures in the first two pillars, the second two similarly matter less, as system reliability issues become more prevalent.
Pillar 1: Producing High-Quality Feedwater through High-Quality Makeup
The first pillar represents a particularly challenging issue in the chemical processing industry. High-quality feedwater is created through the attemperation of high-quality makeup, otherwise known as boiler feedwater (BFW). This process involves controlling and measuring low-level ionic impurities to avoid boiler feedwater contamination, as contaminants can find their way into the steam through the attemperation process.
Pillar 2: Minimizing Condensate and Boiler Feedwater Corrosion
The second pillar focuses on minimizing condensate and BFW corrosion. This is typically accomplished by applying amines or ammonia, as well as through oxygen scavenging.
Generally, the goal is to minimize corrosion products and iron transport through the system. More specifically, we will explore flow-accelerated corrosion (FAC), another major gap faced by chemical and petrochemical plants as well as refineries.
Pillar 3: Selecting the Appropriate Internal Treatment
The third pillar addresses the importance of selecting the right steam gyrator and boiler internal treatment based on a system’s specific needs. This could include all-volatile treatment (AVT) ratio programs using sodium phosphate or all-polymer programs that can be used at lower pressures.
Pillar 4: Using Dispersants for Metal Transport
The last pillar refers to using polymers to disperse iron. In certain instances, this treatment is recommended for reducing iron transport into steam generators and boilers.
Three Common Steam Cycle Treatment Gaps in Chemical Processing Facilities
The four pillars provide a solid foundation for a deeper discussion into the specific challenges many chemical, petrochemical, and refining facilities face.
- 1. Anionic and cationic impurities
- 2. Accelerated corrosion and condensate
- 3. Lack of steam quality monitoring and instrumentation
1. Anionic Impurities and Cationic Impurities
Feedwater quality is a major area of improvement for many chemical processors. In fact, demineralized water quality drives the majority of boiler chemistry needs.
Unfortunately, many plants do not follow best practices and operate boilers with low levels of ionic impurities in their makeup water. Controlling and measuring low-level ionic impurities is an important factor for maintaining boiler efficiency.
Cation Slipping
Plants typically use some form of mixed bed ion exchange to produce higher purity water.
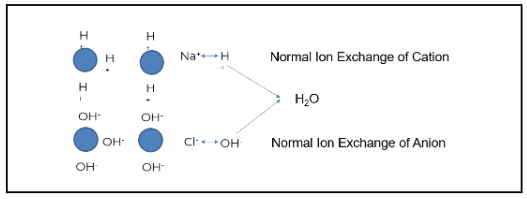
The image above demonstrates how this process works when ion exchange is properly generated and operating as intended. The blue circles represent ion beads. When regenerated, the cation is loaded with a hydrogen or hydronium ion. The anion bead is loaded with a hydroxyl ion.
Using the example of salt (NaCl) and water (H2O), sodium (the cation) exchanges with a hydrogen ion. Chloride (the anionic portion) exchanges with a hydroxyl ion, creating pure water. Under the right conditions, regeneration produces high-quality feedwater. However, gaps such as cation bed slipping can occur when the ion exchange does not operate as designed.
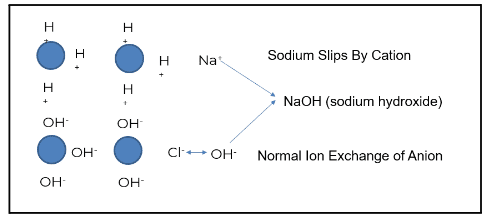
Sodium is a prevalent ion seen when the cation bed starts to slip. In the example above, sodium does not exchange with the hydronium or hydrogen ion; this is known as “slipping.” The slip causes the sodium to go through the chloride. Sodium chloride then exchanges out with a hydroxyl ion, and sodium slips as sodium hydroxide.
The sodium hydroxide will first concentrate in the boiler water, driving up boiler pH. This will increase the sodium-to-phosphate ratio, which, in turn, increases the risk of underdeposit corrosion and caustic gouging. Attemperation contamination reduces the steam quality for turbines, and calcium and magnesium can pass under more stressed conditions.
Even slightly elevated sodium levels pose a risk of sodium hydroxide formation in iron deposits. When this occurs, porous iron deposits in boilers (known as “wick boiling,” which will be discussed later in this article), the boiler water evaporates off, and high levels of iron concentrate remain.
If sodium hydroxide reaches the feedwater, which is normally used for de-superheating, it could directly contaminate the steam going to the turbine blades, reducing efficiency. Hydroxide can also deposit onto the turbine blades in the phase transition zone as it starts to condense, potentially causing stress corrosion cracking, usually on the roots, where the turbine blades attach to the rotor.
Under extreme conditions, as the cation resin is exhausted, the hardness ions of calcium and magnesium will start to pass, which can cause deposit issues in boilers at higher temperatures. Boilers are virtually intolerant to hardness at this level, and calcium magnesium can react with the alkalinity and start to drop out pH in the boiler.
Anion Slipping
Though not as common as cation slipping, anion slipping is an important point to discuss. Interestingly, slipping anions has the opposite effect of a slipping cation. The first anion we typically see slip is silica. Slipping silica combines with the exchanged hydronium ion, forming a slightly acidic species. Depending on the temperature, pressure, and pH, silica in these high-pressure, high-purity boilers is prone to mechanical and vaporous carryover in drums. This poses a risk to turbines; silica forms deposits on turbine blades, reducing efficiency.
Another problem with silica is that, unlike sodium, it cannot be removed with water washing. Silica forms a very tenacious deposit on turbine blades that is difficult to remove.
Other anions that can slip are chlorides and sulfates, which combine with the hydrogen ion to form mineral acids, such as hydrochloric and sulfuric acid, driving down boiler pH. These increase the risk of underdeposit corrosion in porous iron deposits.
If mineral acids enter the steam, they provide another mechanism for stress corrosion cracking in turbine blades.
2. Accelerated Condensate and Corrosion
When it comes to minimizing condensate and corrosion, the main priority is reducing levels of iron and other metal transport into the boilers.
Iron and Copper Transport into Steam Generators
Water systems in chemical processing facilities tend to be large, with complicated condensate systems and extensive steam cycles. Typically, the feedwater going into the boiler will have elevated iron levels, or even yellow metals. Any metal entering the boiler may deposit on boiler surfaces; it is difficult to keep them in solution in higher heat flux areas. This creates potential sites for underdeposit corrosion.
The following images show examples of underdeposit corrosion. The first is a transfer line exchanger (TLE) from a methanol plant, where waste heat gas was sent through the tubes. Acid phosphate wastage caused the formation of underdeposit corrosion sites. The plant had switched to a much higher-level sodium phosphate program years before, but the damage was already done.
The following images show examples of underdeposit corrosion. The first is a transfer line exchanger (TLE) from a methanol plant, where waste heat gas was sent through the tubes. Acid phosphate wastage caused the formation of underdeposit corrosion sites. The plant had switched to a much higher-level sodium phosphate program years before, but the damage was already done.
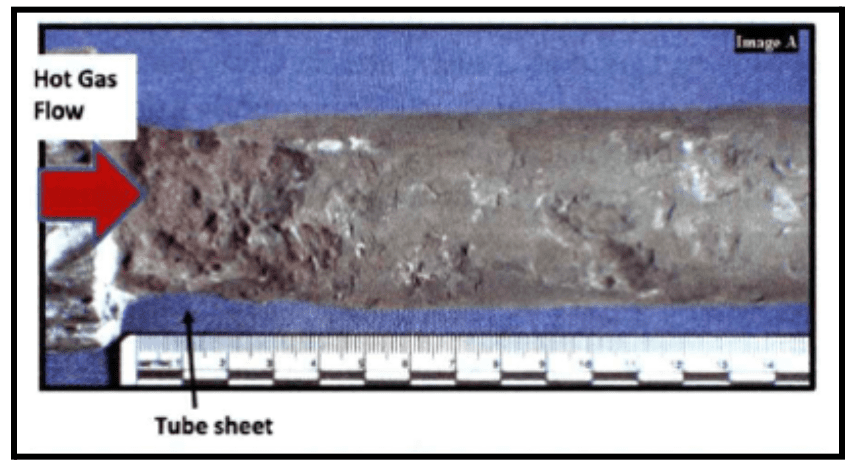
This represents a major challenge of underdeposit corrosion: once it occurs, bulk water chemistry will have minimal effect on existing underdeposit corrosion sites.
The second image is an example of a thick wall failure in a utility boiler. It shows an entire blowout, known as hydrogen damage. This was caused by a very acidic species depositing within the steel matrix and converting the carbon sites over to methane, leading the wall to expand and eventually resulting in the large failure seen here.
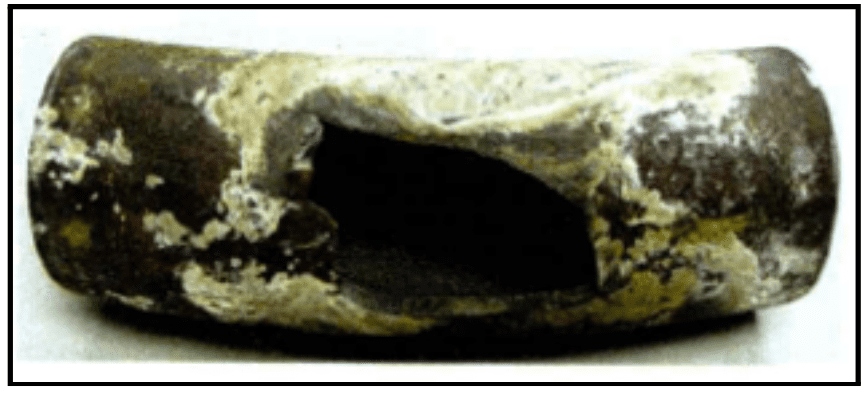
Image courtesy of Kurt Kraetsch, ChemTreat
These images illustrate the importance of pretreatment to boiler efficiency. Effective pretreatment reduces iron and other metal transport into the preboiler. Approximately 30% of iron entering a boiler remains soluble and is taken out via continuous blowdown.
Polymer treatment can help reduce metal transport and may be a good option for boilers with a history of underdeposit corrosion issues.
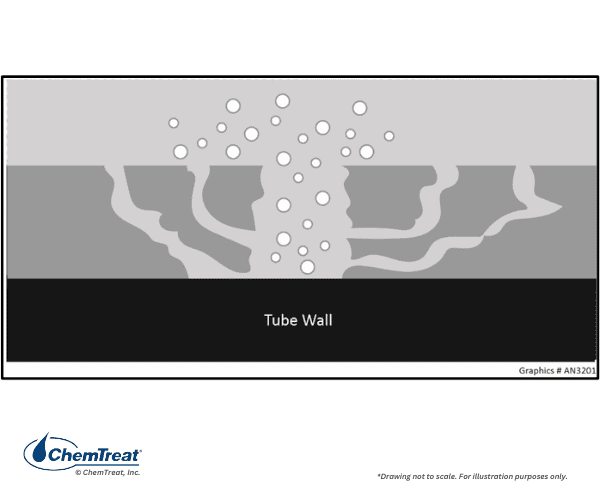
Wick Boiling
The following graphic demonstrates a principle called wick boiling, where porous iron deposits form on a boiler tube’s higher heat flux areas. These deposits occur when water with ionic impurities flows into the tube and evaporates off, creating high levels of concentration of these acidic and caustic species. This results in underdeposit corrosion in the form of tube wastage. Wick boiling typically causes hydrogen damage at a pH of 4, acid phosphate at low pH, and caustic gouging at high pH.
Balancing Mild Steel and Copper Corrosion in the Preboiler
Mixed-metallurgy boilers pose additional water treatment challenges. These boilers are typically made with mild steel and some form of yellow metal, such as copper and copper alloys like nickel and brass.
Copper and steel require completely different types of treatment to inhibit corrosion, which makes it difficult to calibrate treatment accordingly.
For copper, corrosion inhibition usually involves lowering pH to the 7–8 range. Higher levels of oxygen scavenger are typically added to accomplish this.
Mild steel, on the other hand, responds better to amines and a higher pH.
Balancing pH and amine/ammonia and oxygen scavenger feed is a constant challenge in mixed metallurgy systems.
Flow-Accelerated Corrosion: Feedwater and Condensate
Controlling flow-accelerated corrosion (FAC) presents one of the most significant gaps in water treatment for the chemical industry. FAC occurs when the rate of oxygen, or the rate at which the magnetite layer dissolves, is greater than its rate of formation.
Though this concept has long been well-understood, best practices for its mitigation has not been consistently applied in the chemical industry.
The following graphic illustrates the FAC cycle.
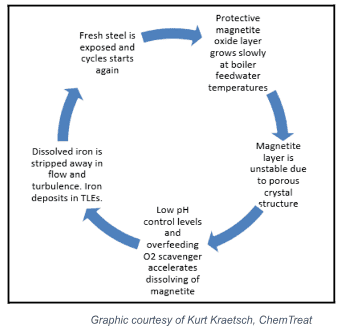
The process begins in the upper right-hand corner. The oxide layer grows slowly at first, as boiler feedwater temperatures are mild.
The magnetite layer continues to grow, developing an unstable, porous crystal structure.
Controlling ammonia/amine and oxygen scavenger comes into play at the next stage, as lower pH and high oxygen scavenger levels accelerate the dissolution of the magnetite layer.
As the iron is dissolved, it is stripped away in high-flow and turbulent areas, forming deposits in TLEs and boilers.
This leaves the fresh metal exposed, restarting the cycle.
Reducing FAC Potential with Feedwater pH Control
The graphic below shows the solubility of the magnetite layer, representing the risk of FAC.
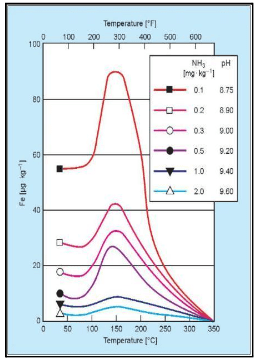
The horizontal axis displays the temperature, while the vertical axis correlates to solubility. The risk peaks at approximately 300°F, or 150°C, which roughly corresponds to standard feed system operation, depending on deaerator pressure.
The individual-colored lines represent pH. As pH increases, the system’s ability to resist the dissolution of the magnetite layer increases. The highest solubility shown on this graph is a pH 8.75, dropping off significantly as pH increases to the 9.4–9.6 range. Thus, balancing feedwater and condensate operation at the highest practical pH, while effectively treating yellow metals, can be very difficult.
Understanding the Impact of Oxygen on FAC
The impact of oxygen on FAC is not well understood. Oxygen works synergistically with aggressive anions like chlorides and sulfates, causing corrosion. However, oxygen can also help reduce FAC.
As previously mentioned, the magnetite layer forming in feedwater systems is porous. If the gaps in the layer are filled with hematite by slightly increasing oxygen ingress, a stronger oxide layer will develop, which is less likely to dissolve and cause FAC.
In all-steel systems, pH is not always set as high as necessary, and reducing or removing oxygen scavenger application may help reduce FAC, depending on iron transport analysis.
3. Lack of Steam Quality Monitoring and Instrumentation
As with the improvement opportunities discussed in the previous section, following best practices around monitoring and instrumentation in steam systems is an important factor of effective water treatment.
Monitoring steam quality helps maintain the purity of the steam going to the turbines. Some common monitoring parameters are reviewed in the next sections, followed by a discussion of the benefits of using instrumentation over relying solely on sampling.
Sodium and Silica
Sodium and silica deposits, as well as aggressive anions like chlorides and sulfates, can cause stress corrosion cracking at the wet ends of turbine blades, reducing system efficiency.
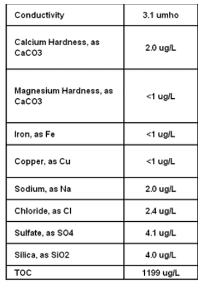
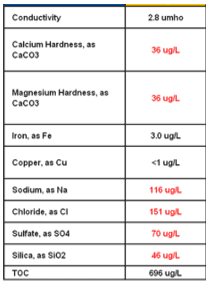
These analytical reports show the presence of various impurities in a 600-pound ethylene unit during standard operations versus a condenser leak. It is important to note the conductivity showed very little change during the condenser leak. This facility used ultra-low-level wet-based testing to track impurities but did not have sodium monitoring in place. Using instrumentation to monitor sodium may have caught the condenser leak earlier.
Monitoring feedwater and steam with instrumentation is a water treatment best practice. However, these systems may be difficult and expensive to retrofit and maintain.
One alternative is monitoring cation conductivity, which provides a good option for testing low-level ionic impurities.
Cation Conductivity Monitoring
There are two primary types of cation conductivity monitoring.
- 1. Degassed cation conductivity, where the water is boiled off, then cooled back down and run through a strong cation exchange column, typically to remove CO2. Newer units may use a nitrogen purge to remove CO2.
- 2. Un-degassed cation conductivity monitoring, in which water is run through the cation exchange column without being boiled off.
Photo courtesy of Hach.
Regardless of whether water is degassed, the key is to measure the conductivity before and after the cation exchange column.
Two Principles of Cation Conductivity Monitoring
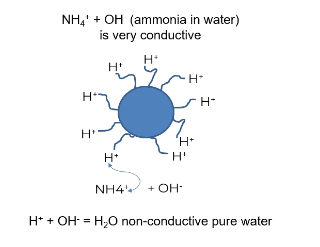
- 1. The majority of conductivity found in steam, feedwater, and condensate systems comes from adding ammonia or amines, not from ionic impurities. Monitoring cation conductivity removes the impact of ammonia or amines on the conductivity reading. The diagram below shows ammonia as ammonia hydroxide in water. The ammonium portion (the cation) will exchange out with a hydronium or hydroxyzine to form pure water, taking out the masking effect produced by amines or ammonia.
- 2. Cation conductivity converts low levels of impurities to acids, which are always more conductive than their neutral salts. During a condenser leak or a period of poor ion exchange, sodium chloride is a typical impurity. The sodium in sodium chloride exchanges out with a hydronium hydroxyl or hydrogen ion to form hydrochloric acid, amplifying the conductivity’s effect by taking low part per billion levels of ionic impurities and converting them into acids.
- a. During the ethylene unit condenser leak shown previously, there was a slight uptake in normal, un-neutralized, or non-cation, conductivity. The average conductivity increased from 3–4.5 to 3.5–4.5. It would typically be difficult to note this difference; however, the cation conductivity shot up by a factor of 10In areas such as feedwater, steam, and condensate systems, cation conductivity offers an efficient way to measure and monitor very low levels of ionic impurities via instrumentation.
The Benefits of Instrumentation Over Sampling
The example above illustrates the importance of instrumentation in helping facilities catch boiler system issues.
Some chemical processing plants still rely solely on “grab” samples, which provide an incomplete picture of the system water quality. Particularly in high-pressure, high-purity units, monitoring with instrumentation is best practice, with grab sampling used only as a backup.
Conclusion
Minimizing corrosion and deposition in high-purity, high-pressure steam generators and boilers is an important component of maintaining system reliability and efficiency in chemical, petrochemical, and refining facilities.
When designing a water treatment program, it is important to keep the four pillars of steam water treatment in mind, as well as identifying areas of improvement based on common gaps.
The ultimate goal of this post was to address these gaps in high-purity, high-pressure steam generator treatment and help your facility improve the long-term reliability of your boilers and steam turbines by implementing best practices around treatment chemistries and monitoring.
As with all other technologies, due diligence is necessary to determine the feasibility of utilizing the methods discussed in this post. It is important to consult your equipment manuals and guides and seek guidance from your local water treatment representative to address the specific needs of your facility.

The post Minimizing Corrosion and Deposition in High-Pressure, High-Purity Steam Generators for Chemical Processors appeared first on ChemTreat, Inc..
]]>The post Three Key Performance Indicators for Monitoring Reverse Osmosis Units appeared first on ChemTreat, Inc..
]]>When operating and maintaining reverse osmosis units in a pretreatment system, there are three key performance indicators (KPIs) to keep in mind:
- Normalized permeate flow
- Pressure change (ΔP)
- Salt passage
However, not all RO systems are built the same. Each manufacturer has specific guidelines for managing their RO units.
RO Cleaning Industry Guidelines
Some operators incorrectly believe their RO units should be cleaned every 3–4 months, but RO manufacturers have differing recommendations for their systems. The parameters for cleaning are outlined below by manufacturer.
- Permeate flow rate drops 10%
- Normalized flow passage increases 5–10%
- Normalized pressure drop increases 10–15%
- Permeate flow decreases by 10%
- Permeate quality decreases of 10%
- Normalized pressure drops 15%
- High fouling levels occur at double the above rates
- Permeate flow decreases by 10% since startup or last cleaning
- Salt passage increases by 10% since startup or last cleaning
- Normalized pressure drops 15% since startup or last cleaning
- Normalized differential pressure increases by more than 20%
- Permeate flow decreases by more than 10%
- Salt passage increases by more than 20%
All manufacturers listed above offer free, downloadable manuals and technical bulletins on their websites. For more detail, please refer to their official websites. Please note this list of manufacturers is not exhaustive.
Sometimes, these guidelines are not followed because upstream pretreatment and filtration systems are not maintained properly, resulting in the need for weekly RO cleanings.
The Importance of Trending Data
When RO parameters aren’t recorded and trended on a regular basis, tracking performance issues becomes difficult. Without proper data trending, permeate flow is only observed when it begins to drop or conductivity increases.
Many operators will wait until they experience a ΔP increase of 40–50 psid across a single stage before initiating a cleaning. Such a significant pressure increase often leads to channeling, where gaps from suspended solids, colloidals, and bacteria pack into the RO. These gaps restrict flow through the unit, creating a flow of least resistance during cleaning.
RO Trending and Maintenance Best Practices
We recommend using manufacturers’ guidelines to establish targets for normalized permeate flow, ΔP, or permeate conductivity increases.
When ΔP increases, it is time to start scheduling maintenance and cleaning procedures.
Key Parameters to Monitor
Monitor ΔP across each stage, not the entire RO
Carefully monitor the first stage if using surface water as makeup. Colloidals passing through into the cartridge filter will cause a ΔP increase into the RO.
If the first stage is experiencing buildup, take an SDI pad and allow it to run until it plugs off.
Send the SDI pad with a couple drops of permeate water to your water treatment provider for a scanning electron microscope and foulant identification to help identify pretreatment issues.
Temperature
- Membranes tighten up as the water gets colder, reducing permeate conductivity.
- Conversely, RO membranes loosen up as the water gets warmer. Warmer temperatures increase permeate conductivity. Organics levels will also rise, subsequently increasing the presence of bacteria in the system.
Free Chlorine
- Free chlorine levels should be maintained at 0.0 ppm for proper operation. When adding a DPD powder pillow, the resulting sample should always be clear with no pink color.
- If using an ORP monitor, DuPont’s FilmTec manual recommends less than 200 millivolts of free chlorine. If using wastewater or gray water, the recommended levels are less than 300 millivolts. However, whenever using ORP, the probe should be calibrated either weekly or biweekly.
Microbiological Fouling
- Microbiological fouling can increase RO pressure. Limits are 100 CFUs/mL in the makeup or 1,000 CFUs/mL in the reject. If these limits are exceeded, a biocide program is recommended.
Feedwater Conductivity and Turbidity
Many RO makeups have two or more streams with different influent conductivity. Use of an on-line conductivity meter allows you to monitor the incoming conductivity to better predict the impact on the permeate. We recommend trending RO conductivity as a best practice for maintaining your RO.
Monitoring an RO System
Proper monitoring of an RO system enables operators to know where fouling will occur and what cleaner to use.
RO manufacturers offer free downloadable trending software, but a spreadsheet can also be used to record and trend data.
A flow meter on the permeate, between the first and second stage, allows for individual trending and targeted cleaning of the two stages.
A first stage ΔP is indicative of biofouling, colloidals, suspended solids, or organics. A second stage ΔP increase mainly indicates scaling.
High-pH cleaners are recommended for high first stage ΔP. Anything not properly treated in the first stage will be pushed into the second stage of the RO. However, if the correct antiscalant is selected to match the incoming chemistry and the recovery rate does not change, scaling should not typically occur.
The Importance of Inspecting Cartridge Filters
Monitoring cartridge filters and changing them out regularly are important steps that often get overlooked. If any sand, particles, or grit are found on the outside of the cartridge filter elements, something upstream has been breached from one of the bottom laterals or a vessel flange that needs to be corrected.
When opening RO membranes, contaminants from the softener, anthracite, or multimedia may be found in the lead element. These cannot be removed with cleaners and must be flushed out through the bottom drains of the cartridge filter housing.
Both cartridge filter drain valves (as pictured below) should be opened when changing out cartridge filters.
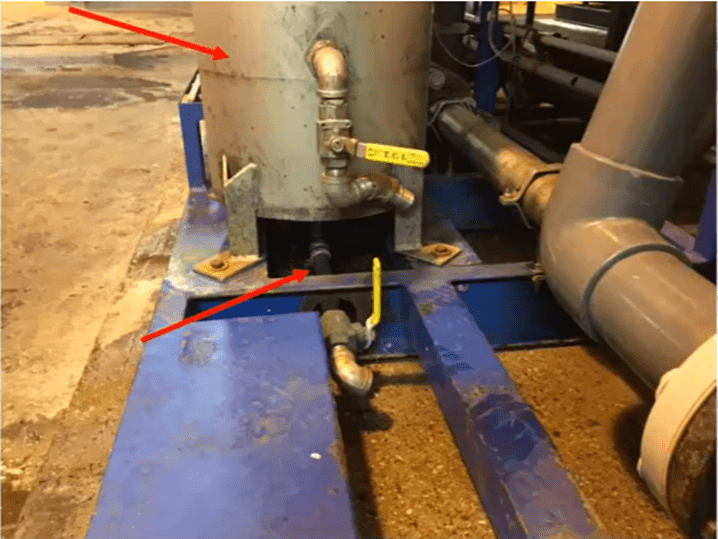
The bottom drain valve should be installed in an easily accessible location. If these are not flushed, foulants will be sent to the bottom compartment and into the lead membrane.
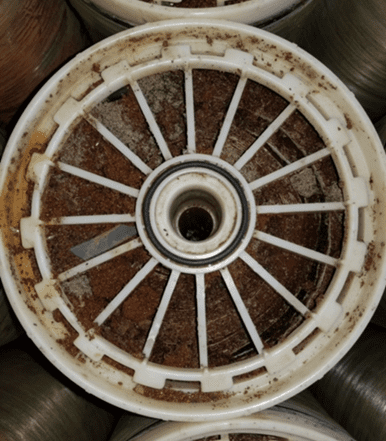
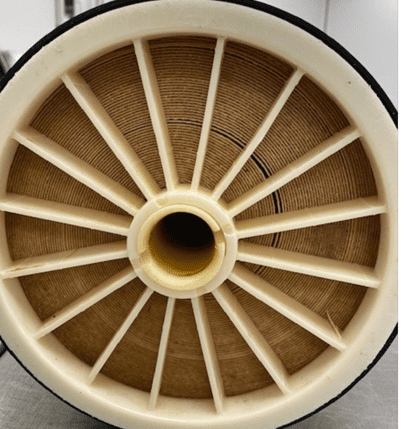
Case Study: Cartridge Filter Fouling Causes RO Issues
A plant was experiencing consistently high ΔP. In the photo below, there is brown debris built up at the base of the stay rods, around the holes meant for filtered water. Any debris not flushed out of the cartridge filter housing will be pushed into the bottom compartment and the lead element. When this happens, it is very difficult, if not impossible, to remove what is lodged into the face of the lead membrane with RO cleaning chemicals.
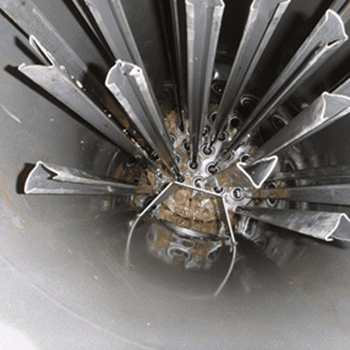
Notice the wide gaps in the membranes below. These were caused by colloidal and particle fouling. Once a gap of any size develops, a flow of least resistance is created, preventing proper filtration or cleaning.
Inspecting the Cartridge Filter Housing
Cartridge filters offer a window into RO operations and are the last means of defense against filtration issues. Let your eyes and your nose be your guide. If something does not look right, report it. If you observe an odor, feel any slime, or notice grit, start to look upstream for the source of the issue and correct it.
Monitoring Guidelines for RO Systems
Monitor conductivity in the feed, permeate, concentrate, or reject.
Sample all ions frequently. What comes in, must go out or be rejected. For example, if running at 75% recovery, everything coming in should be cycling up four times; if there is 100 ppm calcium coming in, there should be 400 ppm going out.
Measure and record the flow of feed, permeate, and concentrate or reject.
Monitor pressure in the feed, interstage, concentrate, and permeate.
If there is not a pressure gauge in the interstage, see if it is feasible to have one installed. This will act as an indicator for the first stage, where most RO fouling occurs.
Measure the pressure in the concentrate.
Keep an eye on feed temperature, pH, and ORP.
Understanding the conditions of all RO stage flows and ΔP allows for proper cleaner selection and targeted cleaning.
RO Readings
Enter all RO readings into a spreadsheet for trending purposes or download the trending software from your RO manufacturer.
First Stage
The first stage experiences the highest flow rate and the lowest incoming conductivity. As a result of the high flow rate, the first stage is prone to bacteria, colloidals, suspended solids, and organics. Coagulant fouling may also occur. High-pH cleaners are used in this stage to mitigate these issues.
Second Stage
The second stage has the highest conductivity. Carbonate, sulfate, hydroxide, and phosphate scaling may occur in the second stage. Low-pH cleaners are paired with the proper antiscalant for second stage cleaning. The exception is silica scale, which necessitates a high-pH cleaner.
The Importance of Data Normalization
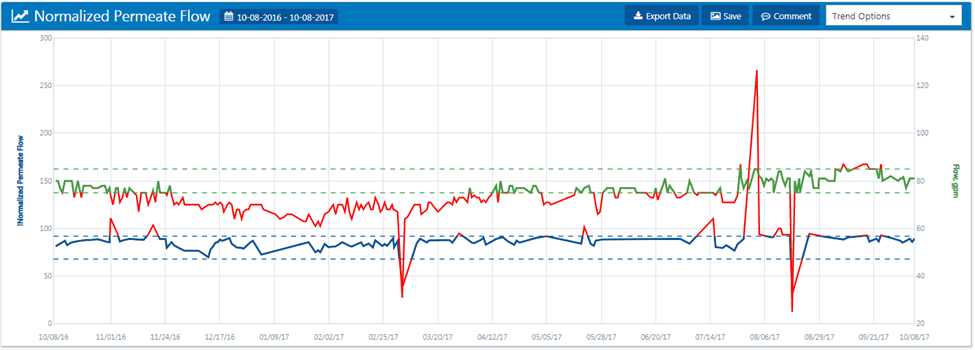
There are two trend lines in the below graph.
The blue line indicates normalized flow, which is a relatively straight line. The peaks and valleys are called “fat fingers,” caused by operators mistyping data points and creating outliers.
The top line trends permeate flow. While the permeate flow fluctuates during normal operation, it may indicate the need for cleaning.
When considering the normalized line, note whether the flow remains within its standard limits. If it does, the RO does not need to be cleaned. Normalized trending also accounts for temperature fluctuations.
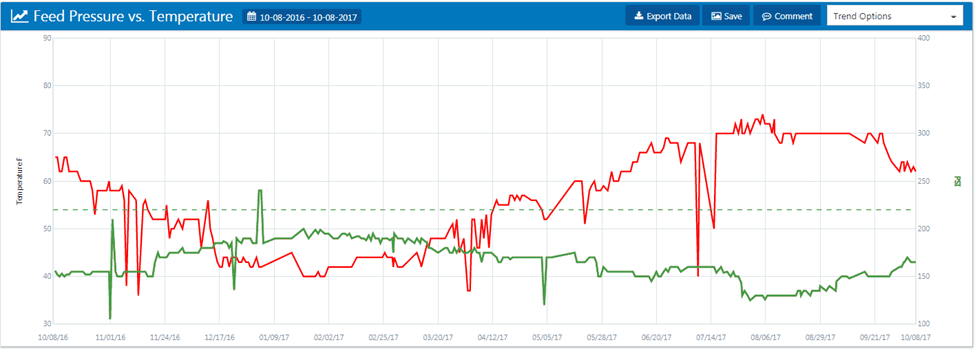
In the graph below, the red line indicates feedwater temperature, and the green line indicates pump pressure.
As feedwater temperature decreases, RO pressure increases because of water’s increased viscosity. More importantly, the membrane pores begin to tighten up in cooler temperatures, causing pumping pressure to increase and permeate conductivity to decrease slightly.
The Consequences of Not Trending and Normalizing RO Data
According to the DuPont FilmTec RO manual, page 130, “if you wait too long, cleaning may not restore the membrane element performance successfully. In addition, the time between cleanings becomes shorter as the membrane elements will foul or scale more rapidly.”
If an RO is not taken out of service and cleaned in a timely manner, channeling or gaps may develop, and cleaning may no longer restore the unit’s baseline. It is very important to monitor trends and clean ROs when necessary.
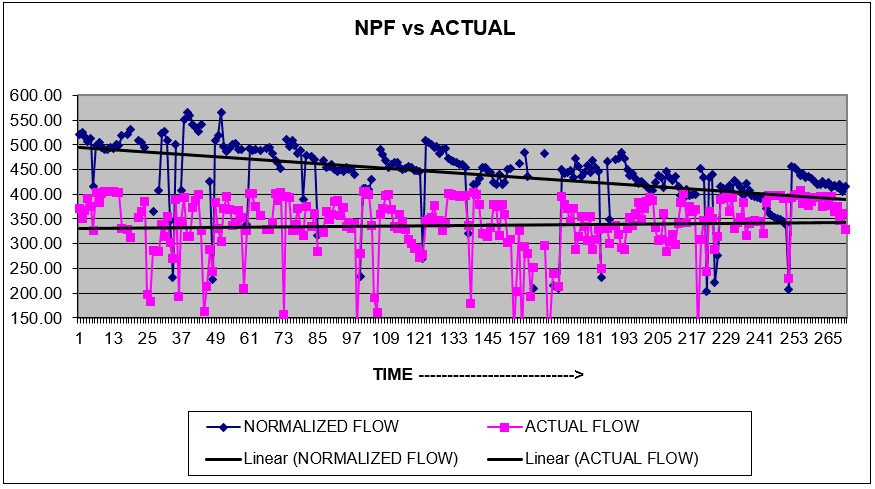
The above shows a very good example of normalized versus permeate flow. The trend lines appear rather busy; however, the dark blueline of the normalized permeate flow is slowly falling and never returns to the baseline. This indicates the operator has waited too long to clean the RO.
It is important to be proactive when noting a downward trend. In this example, operators should set up the clean-in-place (CIP) and schedule a cleaning. Otherwise, the membranes will eventually need to be replaced.
Waiting Too Long to Clean an RO
In the schematic below, the blue bar represents the membrane sheet, and the brown circles represent the feed spacer. As feedwater flows through the RO, colloidals and bacteria will become packed in the feed spacers. Bacteria excrete polysaccharides, which will attract and trap colloidals and suspended particles that are difficult to clean out.
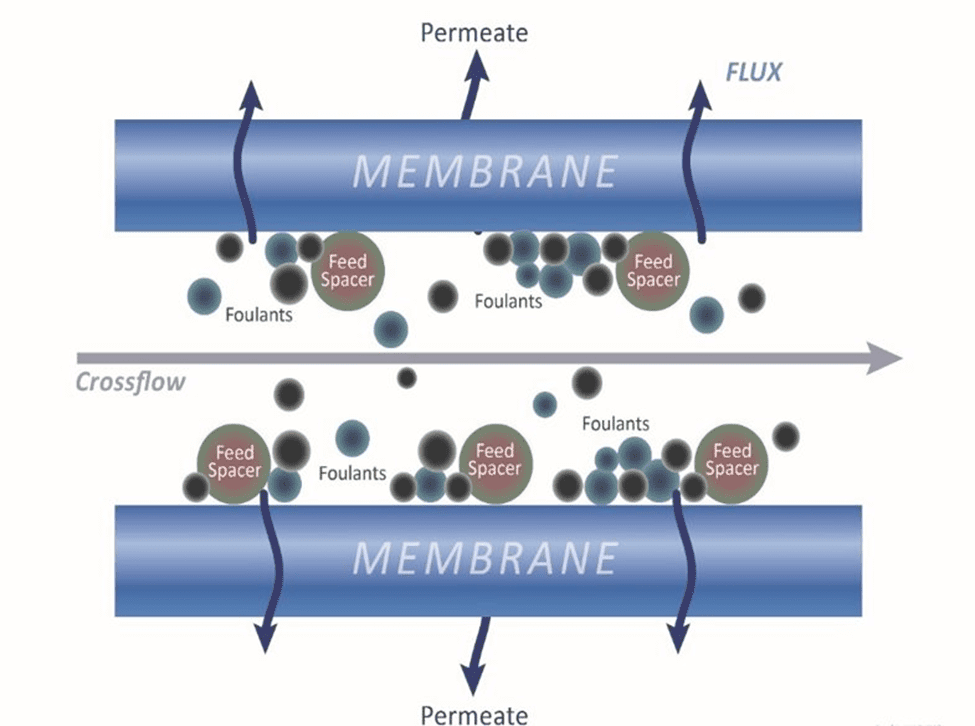
These trapped foulants require a more aggressive cleaning treatment or a very high-pH cleaner to treat. The more the ΔP is allowed to increase, the more difficult cleaning becomes.
Notice the two narrow crescent-shaped gaps in the membrane above. Once a gap forms, they are permanent and cannot be undone. Service flow and cleaning chemicals will follow the path of least resistance through these gaps, making cleaning more difficult.
In some instances, the gaps become so enlarged that the ΔP will increase and then plateau, so there is no more ΔP building up in that membrane. When this occurs, the areas without water passing through will become stagnant, causing a virtual dead zone.
Six Key Takeaways
The following best practices are recommended for maintaining RO efficiency.
- Monitor the first stage ΔP closely, especially if using surface water. Make it a habit to scan the first stage ΔP and temperature.
If temperature decreases, the ΔP and pump pressure will increase because the membrane pores are going to tighten up. That does not mean cleaning is required in this instance. Look at the normalized data.
- Adhere to target set points for RO cleaning. Most of the time, fouling will occur in the first stage, particularly if using surface water.
If water chemistry is being monitored and trended, RO scaling will become evident. When a proper antiscalant is used and the recovery rate does not change, last stage scaling is not typically a concern.
- Monitor for microbiological activity in the feed, reject, and cartridge filter housing. Even with the targeted chemistry levels, 3 ppm total organic carbon (TOC) or higher will provide food for bacteria.
- Observe the cartridge filter housing. Smell and feel for the presence of slime. Check the condition of the internal surfaces: look for chips.
- Monitor permeate conductivity. If the permeate conductivity is increasing, determine whether temperature has changed, or the incoming conductivity has increased.
- Watch for any free chlorine entering the RO membrane. 0.0 ppm and a clear color on the DPD test indicates the absence of free chlorine.
The more data is gathered and trended, the easier troubleshooting RO issues becomes. Data collection and normalization enables operators to schedule cleanings and ensure the necessary manpower, chemicals, equipment, etc. are available.
Monitoring these six key areas of the RO provides operators with the necessary understanding of how the three KPIs are trending, indicates the conditions impacting the RO, and helps avoid RO autopsies.
As with all technologies, due diligence is necessary for determining the feasibility of utilizing these methods. Always consult your equipment manuals and guides and seek guidance from your water treatment provider to address your specific system needs.
References
DuPont . Feb 2023, Version 16. FilmTec Reverse Osmosis Membranes Technical Manual. Retrieved from: https://www.dupont.com/content/dam/dupont/amer/us/en/water-solutions/public/documents/en/RO-NF-FilmTec-Manual-45-D01504-en.pdf.

The post Three Key Performance Indicators for Monitoring Reverse Osmosis Units appeared first on ChemTreat, Inc..
]]>The post Film-Forming Amines: Innovative Boiler Treatment Technology for the Refining Industry appeared first on ChemTreat, Inc..
]]>This innovative technology can be particularly beneficial for refineries, where maintaining utility system conditions is important for production efficiency.
Film-Forming Amine Treatment vs. Traditional Boiler Treatment
Traditional boiler treatment programs do not generally include a corrosion inhibitor. Pretreatment is used to reduce scale and corrosive ions, and oxygen levels are reduced via mechanical and chemical means. pH is raised to passivate metal surfaces, and temperature is increased to deoxygenate the water through a deaerator, helping build the passive layer.
In complicated systems such as those seen at refineries, these standard processes may not achieve the desired level of corrosion inhibition. Film-forming amines can be a beneficial supplement to the treatment program, as they bind directly to the metal surfaces, where corrosion is typically more difficult to treat.
Benefits of Film-Forming Amine Treatment for Refinery Operations
FFA programs have primarily been used in power industry applications in the past. However, they can offer significant benefits to applications specific to the refining industry.
Soft Water Systems
In combination with an existing corrosion inhibition program, FFA can help:
- Reduce amine usage
- Treat complicated and extensive condensate systems and reboilers, as well as mixed-metallurgy systems containing copper and iron
- Inhibit corrosion during layup periods
Higher Purity Systems
FFA can help reduce corrosion in the following higher purity systems:
- Low-pressure waste heat boilers such as SRU condensers
- Mixed metallurgy systems balancing pH and oxygen scavengers
- Condensate and feedwater systems, where reducing iron and copper transport via corrosion inhibition may help reduce the risk of underdeposit corrosion.
These products also help reduce flow-accelerated corrosion and issues related to layup.
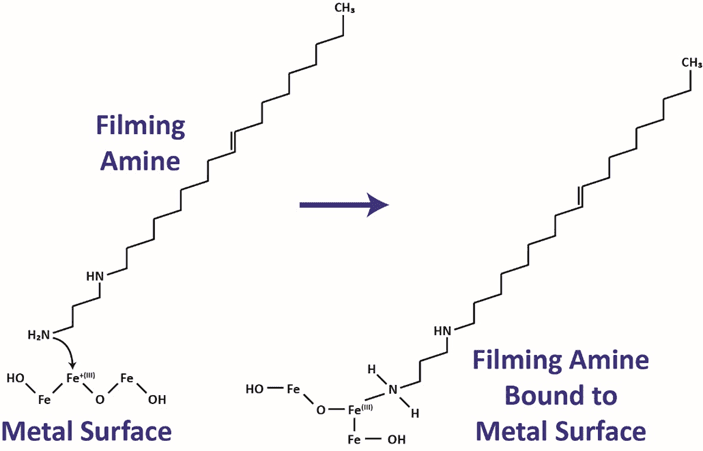
What are Film-Forming Amines and How Do They Work?
Film-forming amines contain a long chain hydrocarbon as part of the molecule. The amine portion of the molecule allows it to form an attachment to the copper or iron within the oxide layer on the metal surface. The hydrocarbon portion of the molecule repels water, inhibiting water transport to the surface where the film is formed.
In traditional treatment, mild steel develops a passive oxide layer by building layers of magnetite particles that get progressively less organized and irregular in shape as they move away from the surface. The stacking of these particles decreases the corrosion rate so smaller, more organized particles result in decreased layer depth. Particle size is strongly influenced by the solubility and mobility of the magnetite particle as well as the oxidation rate of the corroding ferrous iron from the metal surface.
A low concentration of oxygen increases the oxidation rate of ferrous iron dissolving from the surface, which both increases magnetite formation and allows for the formation of low concentrations of hematite.
Hematite forms an iron oxide polymer that interacts with the magnetite, decreasing its mobility. This reduces the particle size and cements the particle in place, allowing for a more compact, passive, and stable iron oxide layer.
With FFA treatment, the epitaxial layer is depleted, and a film is formed to create a hydrophobic surface. If the FFA residual is decreased below a film maintenance level, the epitaxial layer will regrow to its original depth.
FFA treatment will remove the less organized top portion of the iron oxide layer because it is not bonded with the other particles as effectively. Once the looser iron oxide layer is removed, the film starts to build and increase in density as more treatment is added.
Measuring Hydrophobicity
A successfully applied FFA program will create a hydrophobic layer on boiler surfaces.
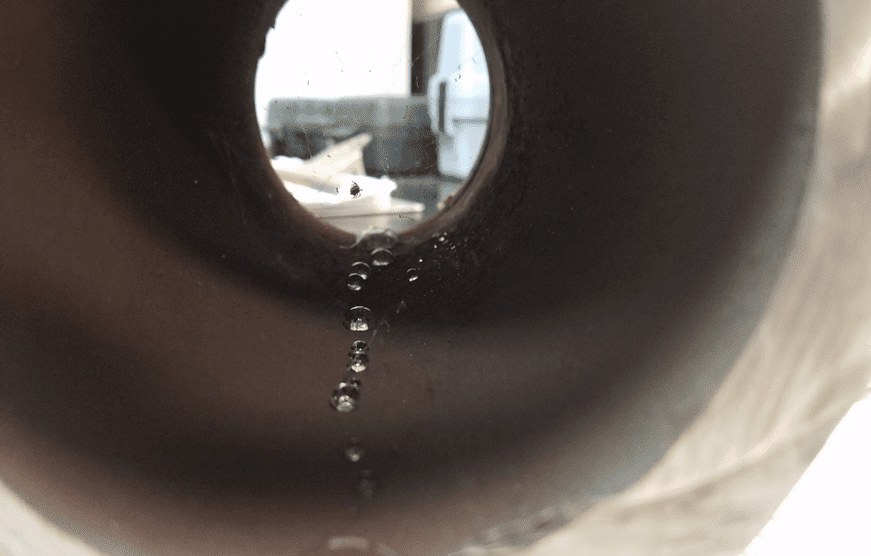
Image of a steam drum with a hydrophobic layer of FFA. Water droplets stay on the surface of the drum without being absorbed into the surface and causing corrosion.
Preparing for FFA Application: What You Need to Know
Prior to feeding FFA treatment in your boiler systems, several factors may need to be considered. These include, but are not limited to:
- Water analysis data: is water chemistry on target based on industry guidelines?
- Where does the water go?
- What percent of condensate is returned?
- Does condensate get polished?
- Are there any blowdown restrictions?
- Historical data
- pH trends for drums, steam system, and hotwell
- Iron residual trends for drums and hotwell
- Cation conductivity trends in the hotwell
- Deposit weight density
- Boiler inspection reports
- Pictures of drum internals
- Economizer and evaporator tube wall thickness measured by ultrasonic testing
How is FFA Treatment Performance Measured?
To monitor the effectiveness of FFA treatment, tracking the following parameters is recommended:
- Iron residual reduction (benchmarked against historic iron residual levels)
- Reduction in corroding areas (benchmarked against past inspections)
- Hydrophobicity
- Integrity of the piping based on surface analysis
Frequently Asked Questions
Does ChemTreat feed FFA as a stand-alone program for deposit, scale, and corrosion control?
ChemTreat does not feed FFAs as a standalone program. We feed film-forming amines as a supplement to traditional treatment programs for systems that need an enhanced level of corrosion inhibition.
Does this technology “gunk up” like previous generations utilizing octadecylamine (ODA) chemistry?
ChemTreat’s FFA technology is more volatile than products such as ODA and does not have the same solubility issues. Filming amines can also be tested to verify that product is not being overfed. FFA application has not caused issues such as gunking, probe fouling, strain clogging, etc.
Are filming amines sensitive to pH?
Unlike previous generations of this technology, ChemTreat’s filming amine is not pH-sensitive, so the hydrophobic layer stays intact if pH increases.
Do filming amines bind catalyst sites?
ChemTreat’s FFA technology has been fed in systems where steam directly contacts with catalyst sites, and we have not observed the product binding with catalysts. Catalysts are very active sites that operate at a temperature above the stability of FFAs, so we would not expect filming amines to bind with them.
Is FFA the Right Treatment Solution for my Refinery?
As with all other technologies, due diligence is necessary to determine the feasibility for utilizing the methods discussed in this post.
It is always important to consult your equipment manuals and guides and seek guidance from your local water treatment representative to address your specific needs.
Contact ChemTreat today to see if FFA treatment is right for your facility.


The post Film-Forming Amines: Innovative Boiler Treatment Technology for the Refining Industry appeared first on ChemTreat, Inc..
]]>The post <strong>LEED Certification: How ChemTreat Can Help</strong> appeared first on ChemTreat, Inc..
]]>ChemTreat offers support to companies seeking LEED certification in several areas.
ChemTreat Support for LEED Certification
Programs to Help You Earn LEED Credits
Our experienced team can provide support in the following areas:
- Reducing the carbon footprint of cooling and heating systems by using locally manufactured products and low-carbon raw materials
- Reducing carbon emissions from operations or capturing carbon from processes using flue gas scrubbers for facilities with waste treatment plants
- Helping facilities go carbon negative by converting atmospheric carbon dioxide into carbonate alkalinity, which can be separated out in a treatment plant
- Improving system efficiency by treating cooling systems and air scrubbers to reduce pathogens, remove volatile organics and other air pollutants, and mitigate corrosion
- Reducing the toxicity of the waters discharged from cooling and heat systems
- Lowering air pollution from cooling tower plumes that may contain toxic or harmful substances or large particulate emissions
Designing a New Facility
Get in touch with our team as early as possible in your design phase. We can help with:
- Devising an optimal cooling system with minimal blowdown so you can get the most out of each gallon of water you use
- Planning out efficient heating and boiler systems that capture returned condensate and pull heat from discharged water, so BTUs are not sent to the drain
- Assisting with the creation of a zero-liquid discharge (ZLD) facility, which may involve installing clarifiers or filtration, softeners, and/or reverse osmosis (RO) systems
Certifying an Existing Facility
We also support existing facilities looking to get LEED certified. Our team can help with:
- Auditing current energy and water consumption to identify gaps and recommend process improvements, including system cleanings and treatment program optimizations
- Supporting facilities looking to transition to Zero-Liquid Discharge by advising on equipment and facility needs
If you’re looking to earn LEED credits at your facility, contact ChemTreat today and let us help you on your journey toward meeting your environmental goals.
The post <strong>LEED Certification: How ChemTreat Can Help</strong> appeared first on ChemTreat, Inc..
]]>The post <strong>Reduce, Reuse, Recycle: Promoting Sustainability and Efficiency in HVAC Systems</strong> appeared first on ChemTreat, Inc..
]]>Water and Energy Consumption Overview
The primary consumers of water and energy in HVAC systems are boilers, closed loops, and cooling systems.
Boilers
In general, boiler systems provide heat for HVAC and other processes, consuming quite a bit of energy and potentially large amounts of water.
Closed Loop Systems
Closed loop systems are filled with a set volume of water, and they do not consume much water unless experiencing a leak. However, they do consume energy by pumping water around a facility, generally for heating and cooling purposes.
Cooling Towers
Evaporative cooling towers consume a great deal of water and are one of the most efficient methods for ejecting heat from inside a building or facility to the atmosphere.
Water Cooling
Chillers
Air-cooled chillers require approximately 1.5 kilowatts per ton of cooling, whereas water-cooled chillers use approximately 0.85 kilowatts per ton. A ton of cooling is equivalent to 12,000 Btu’s.
Air-cooled chillers have a much lower daily capacity than water-cooled chillers because they require more surface area. Their capacity is typically limited to 7.5–500 tons of cooling, whereas water-cooled chillers can be quite large, with a capacity of up to 4,000 tons.
| Air-Cooled Chillers | Water-Cooled Chillers | |
| Efficiency | 1.5 kW/ton of cooling | 0.85 kW/ton of cooling |
| Capacity | 7.5–500 tons | 10–4,000 tons |
Cooling Towers
The purpose of an evaporative cooling tower is to maximize the surface area of the water flow to transfer heat to the atmosphere through evaporation of water. Air is pulled up through water falling through or spraying down through the cooling tower, and heat is drawn out. This process can waste a great deal of water if not optimized with proper treatment and control; therefore, cooling towers should be one of the first pieces of equipment you evaluate when looking to reduce water usage.
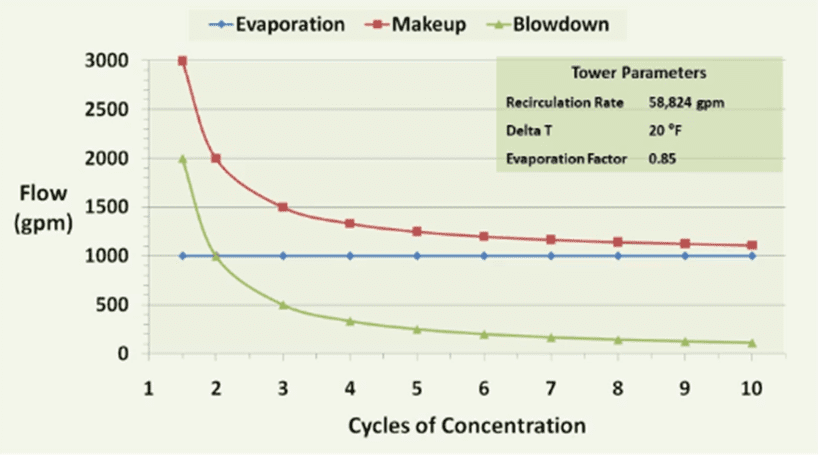
This graph depicts the relationship between the makeup water added to a cooling tower, discharged blowdown, evaporation, and cycles of concentration. The amount of evaporation depends on the amount of heat added to the cooling water by system processes. This heat is removed and ejected to the atmosphere outside. This is relatively constant as dictated by the heat expelled by the chiller to the water. Every pound of water evaporated through the tower removes nearly 1,000 Btu’s of heat.
The amount of makeup and blowdown water depends on the cycles of concentration, or how many times each volume of water is evaporated. In a once-through system, water passing through the tower is sent directly to the drain. These evaporative cooling towers consume the most amount of water. Without controlling blowdown, 1.25–1.50 cycles is the typical range. With some blowdown control, at 2 cycles of concentration, the makeup water requirement drops from 3,000 to 2,000 gpm, a reduction of over 30%. Savings further increase from 2 to 3 cycles with a 25% reduction; however, as the level approaches the constant volume of evaporated water (indicated by the blue line in the graph above), returns begin to diminish.
Increasing cycles can contribute to a higher mineral concentration as water evaporates, which can lead to scaling and fouling. These issues need to be controlled to maintain system efficiency.
HVAC Sustainability: Maintaining Equipment
At installation, new equipment runs at maximum efficiency. The goal of a good water treatment program is to maintain equipment in like-new, as-manufactured condition by keeping surfaces clean and mitigating corrosion and microbiological blooms. Fouling from dissolved minerals in makeup water can insulate heat transfer surfaces if not managed properly. Corrosion deposits on heat exchanger surfaces pose another risk, as does direct exchanger surface corrosion caused by heat flux. Corrosion products can insulate heat exchanger surfaces, impairing equipment performance while requiring greater energy to achieve the same degree of cooling.
Use of high-quality makeup water helps preserve equipment’s as-manufactured condition. Additionally, fouling potential must be balanced with the maximum degree of evaporation.
When seeking to improve sustainability, alternative sources of makeup water should be investigated to supplement and reduce the primary makeup source. A trained water treatment team can audit your water systems and come up with suggested sources of reuse water.
Why are Chemical Inhibitors Necessary?
Chemical inhibitors are used to mitigate the interrelated processes of corrosion deposition and biofouling from bacteria and algae or plant life. Corrosion can lead to deposition, and corrosion and deposition can both lead to biofouling. These issues will negatively impact system efficiency.
Conserve Energy by Maintaining Cleanliness
If you’re looking to conserve energy at your facility, keep the following in mind:
- Dirty systems are not as efficient as clean systems. They require more pumping water to achieve the same degree of cooling because the surfaces are not being cooled effectively. Fouling can also divert flow through the tower fill, insulate heat transfer, and put greater strain on system pumps.
- Mineral scale from makeup water and microbiological fouling may cause more energy to be consumed and prevent heat transfer and cooling.
- If fouled, heat exchangers can become large consumers of wasted energy.
- 1/16 inch of scale on heat exchanger surfaces in a 500-ton chiller could easily cause consumption of over $100,000 worth of energy compared to $80,000 if it were clean. This consumption is directly related to greenhouse gas emissions, which would increase proportionally.
| 500-Ton Chiller | Clean Condenser | Scaled Condenser |
| Electrical Costs | $80,000/year | $105,000/year |
| Water Use | 7,200,000 gallons/year | 7,200,000 gallons/year |
| CO2 Generation | 2,500,000 pounds/year | 3,310,000 pounds/year |
Water Resource Management
Recycling water entails treating streams of otherwise unsuitable water by investing in treatment and equipment to obtain high-quality water.
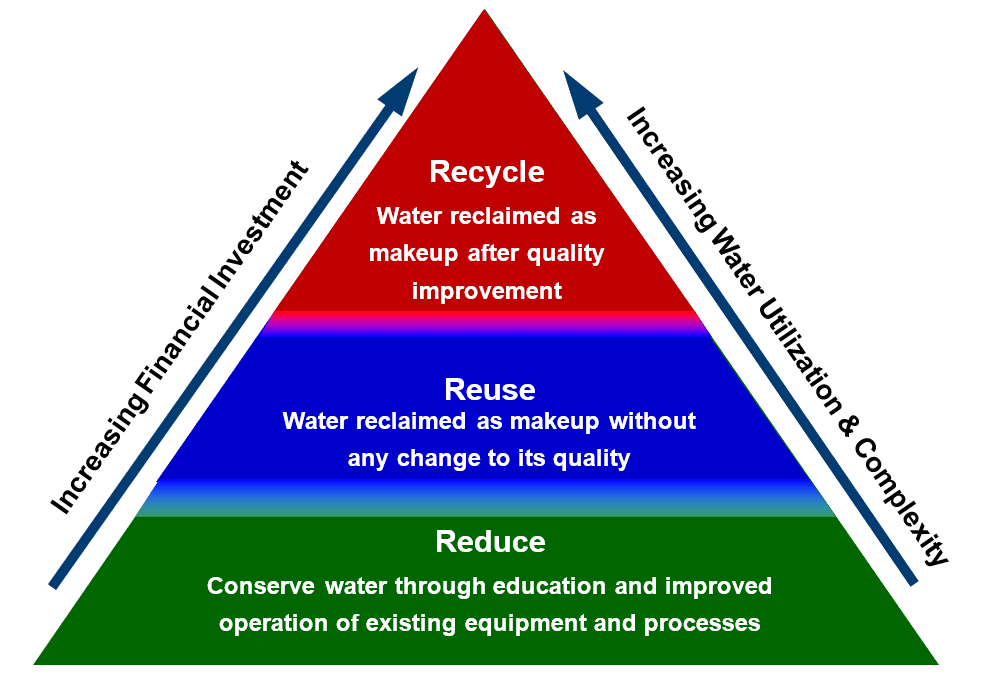
Reduce
The first step in reducing water usage is to ensure systems are operating at maximum efficiency. Strategies may include:
- Reviewing work practices to eliminate waste, immediately repairing any leaks
- Optimizing water source usages
- Improving equipment efficiency by increasing cycles of concentration for evaporative cooling
- Conserving water through education
Educating yourself on the operations and needs of your system is a vital step for effective water and energy reduction. This can consist of:
- Knowing the optimum setpoints for your cooling tower to prevent waste when the system is not operating at the maximum cycles of concentration based on the makeup water chemistry
- Maximizing boiler system cycles
- Cleaning fouled surfaces immediately to prevent energy impairment
- Mitigating equipment corrosion to prevent additional CO2 consumption associated with the manufacture and replacement of equipment and piping
- Maintaining system performance to minimize the need for remediation
- Although cleaning a fouled system with acid can be effective, it can also cause corrosion and impair equipment, wasting energy and water. It is best practice to maintain system cleanliness instead of waiting for fouling to occur before resolving system issues.
Reuse
Depending on its quality, some of the water used in your facility may be reused in other processes without requiring a heavy investment in pretreatment equipment.
Examine the quality of any water you may want to add to makeup streams. If the quality of the water is sufficient for reusing in other processes, you can install equipment to capture that water and plumb it to a usable location.
For example, boiler blowdown may replace city water in closed loops, eliminating boiler additions to the discharge stream and reducing costs.
Recycle
Cooling tower water is not reusable if a constituent in the water is at its maximum stable concentration, limiting additional cycling. A cooling tower operating efficiently will maximize the concentration of the minerals in the water. The resulting concentrated water can contribute to scaling when reused if not properly pretreated to remove dissolved solids.
Recycling saturated cooling tower water involves capturing effluent and installing equipment such as reverse osmosis (RO) systems or softeners to remove calcium and magnesium, the two primary components of scale formation caused by over-cycling.
Municipal Gray Water
Many plants underutilize gray water generated at their local municipal facilities. Gray water is different from water containing sewage; it typically comes from washing applications (showering, washing machines, etc.).
Advantages of Using Gray Water
- Costs less than city water
- Reduces effluent discharge to the receiving stream
- Has fewer quality issues (such as salinity and brackishness) than alternate secondary water sources such as surface waters
- Contains some treatment chemicals such as chlorine or a scale or corrosion inhibitor
Challenges of Using Gray Water
- Quality varies as industrial processes and treatment change
- High levels of organics increase the risk of microbiological blooms and chlorine demand
- High phosphate concentrations may contribute to deposition and add nutrients for bacteria and algae
- May contain or produce airborne pathogens such as Legionella
- The presence of ammonia may increase chlorine demand and nitrifying bacteria and cause copper alloy corrosion
Sustainability Services
Audits & Reports
The ChemTreat team can evaluate your existing treatment program and historical system data to gain a deep understanding of how water is used at your facility. During their tour of your plant, our representatives can create a sketch of the water systems, which our Visual Design team can turn into a detailed schematic for your reference.
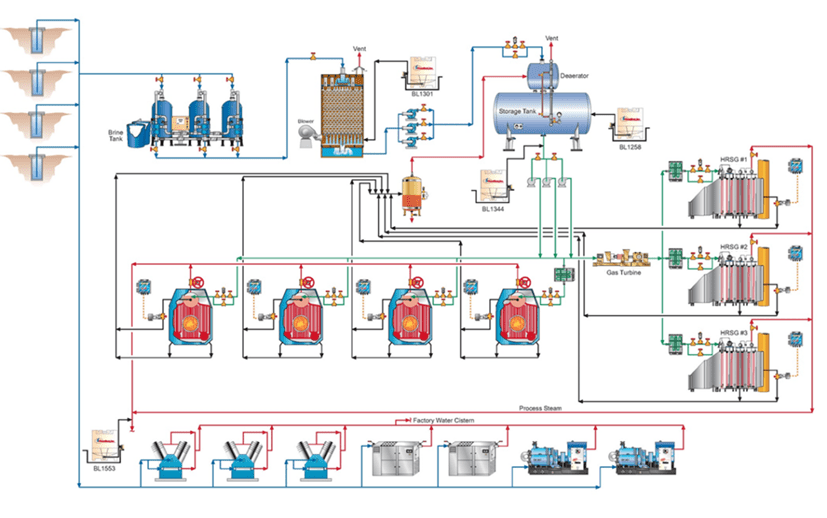
These illustrations are useful to help understand how water is balanced through a facility, where water is flowing, and where it is discharged.
Our representatives will note areas in your systems where energy and/or water are being wasted and work with our subject matter experts to put together a report outlining recommendations for system improvements.
Technology
Computer Modeling
Computer programs like ChemTreat’s CTVista®+ intelligent water management software provide additional insight to augment in-person audits. We use both in-house and third-party water modeling programs to come up with recommendations for optimizing water usage.
These programs can advise on key system parameters such as pH and saturation of minerals such as calcium, magnesium, and silica. The Langelier Saturation Index can be used to determine the optimum range for operation without wasting water. A good operating window includes avoiding:
- Evaporating too much water and over-concentrating minerals until they become unmanageable and precipitate on heat exchanger surfaces
- Under-cycling and wasting good quality water
Automation
Automation is recommended for optimizing cooling systems and helping prevent waste and fouling. Even small fouling levels are cumulative and can eventually impair efficiency, so correcting issues as soon as possible is recommended.
Automation offers superior on-line control and monitoring of water treatment chemistries. The data collected by automation technology also improves KPI monitoring to ensure results are being achieved and sustained.
Traditional methods for monitoring and controlling water systems involve grab samples and bench testing to analyze inert tracers present in chemical treatment. These traced chemicals can present increased treatment costs.
Newer methods use ion-selective electrodes to directly read inhibitor levels, eliminating the need for sampling and water conditioning. These low-maintenance sensors can output information to data logging software. Specific parameters such as water flow, temperature, pH etc. can be tracked to alert operators when water quality is outside the specified limits.
Software such as CTVista+ can also compile collected data to generate reports that can be sent to operators on a regular basis to increase visibility of system trends and offer insight into where adjustments may be needed.
Data Analytics and Predictive Technology
Modeling software such as ChemTreat’s Condenser Performance Monitoring Program can gather plant data and analyze it to aid in pinpointing specific system issues as well as provide troubleshooting guidance. These tools can also help determine when a system cleaning is needed to maintain efficiency.
Advancements in Water Treatment Chemical Development
In a holistic water treatment program, all connected systems in a facility or campus are evaluated to ensure downstream performance is not negatively impacted by upstream treatment. Chemicals such as phosphates, for instance, should not be added if downstream systems are having bacteria issues.
Additionally, some inhibitors are limited by the EPA, making it difficult to apply enough product to achieve the desired results/protection.
It is not unusual for a cooling system program to contain phosphate, potassium, or nitrogen, which act as macronutrients and make it difficult to mitigate algae and bacterial blooms. This is a big reason the EPA limits these items in discharge.
Applying cost-optimized inhibitors can increase sustainability gains. For instance, ChemTreat’s unique FlexPro® inhibitor offers a non-fouling treatment option.
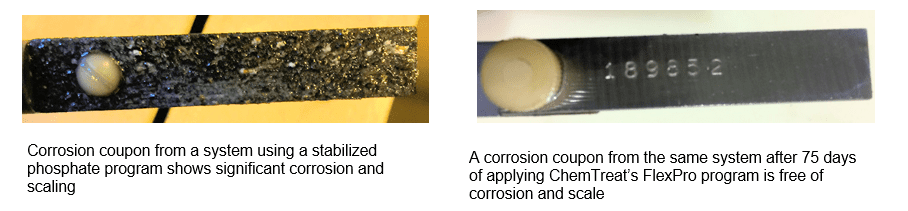
Phosphate reacts with calcium to form calcium phosphate scale on heat exchanger surfaces. The following charts illustrate the relationship between water or tube wall temperature and heat transfer resistance. This example is at a Gulf Coast site using phosphate treatment during a very hot summer. The high temperature increased saturation and caused phosphate fouling, which impaired performance. The operators performed periodic acid cleanings throughout the summer to restore heat transfer and remove calcium phosphate scale.
ChemTreat removed phosphate from the program to achieve excellent corrosion protection without fouling the heat exchangers. Heat transfer was maintained even on hot summer days, allowing the facility to stay on-line longer while reducing the frequency of acid cleanings. This improved the site’s environmental outlook, as acid cleanings can expel contaminants to wastewater plants and the environment while also elevating greenhouse gas emissions by increasing the quantity of solids and phosphates in the discharge water.
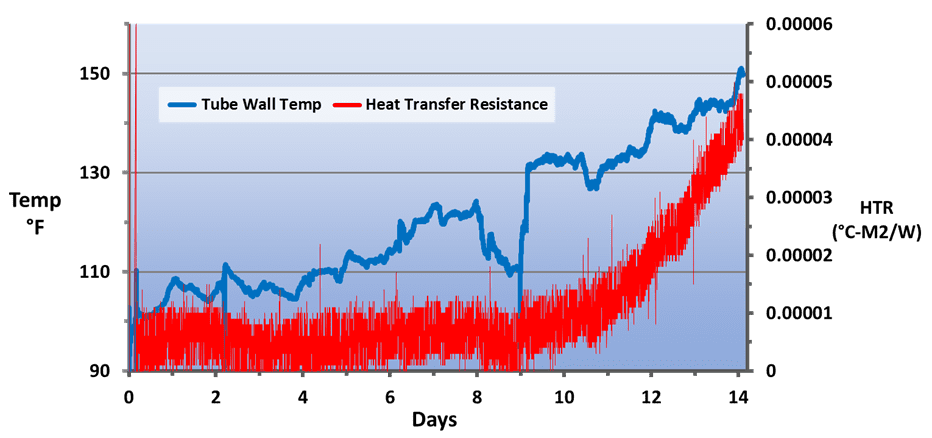
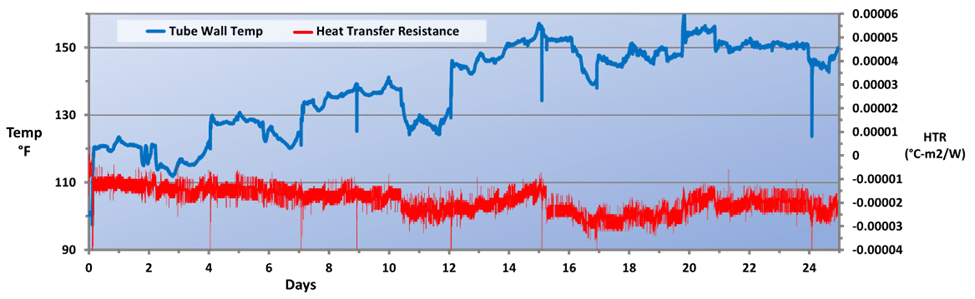
Results are examples only. They are not guaranteed. Actual results may vary.
Summary
To enhance the sustainability of your water systems and treatment programs, it is important to keep the following steps in mind:
Step 1: Reduce Water and Energy Consumption
- Ensure equipment is operating at maximum efficiency
- Use historical data of water temperatures and energy consumption from when the equipment was new to benchmark performance
- Operate at maximum efficiency and cycles of concentration while minimizing water consumption
Step 2: Reuse Water
Work with your water treatment provider to find ways to reuse water at your facility. Water sources such as air handler condensate and rainwater tend to contain few contaminants and will not require much pretreatment for reuse.
Step 3: Recycle Water with Advanced Technology Offerings
Even seawater or water with high levels of dissolved solids can be recycled in plant processes if the proper equipment is in place. Investing in filtration and/or RO systems can help your facility recycle more water.

As with all other technologies, due diligence is necessary to determine the feasibility for utilizing these methods. It is always important to consult your equipment manuals and guides and seek guidance from your local water treatment representative to address your specific needs.

The post <strong>Reduce, Reuse, Recycle: Promoting Sustainability and Efficiency in HVAC Systems</strong> appeared first on ChemTreat, Inc..
]]>The post A Guide for Troubleshooting and Treating Demineralizers appeared first on ChemTreat, Inc..
]]>What is Demineralization?
Demineralization is a process for high-purity water production using ion exchange. It is commonly used in industries such as semiconductor manufacturing and pharmaceuticals as well as in high-pressure boiler feedwater applications. Demineralization is achieved using demineralizers, which are chemicals used to remove minerals from water.
Demineralizer Process Flow Overview
The schematic below shows the process flow from a cation unit all the way to a mixed bed polisher. (A basic demineralization stream would only include a cation unit and an anion unit.)
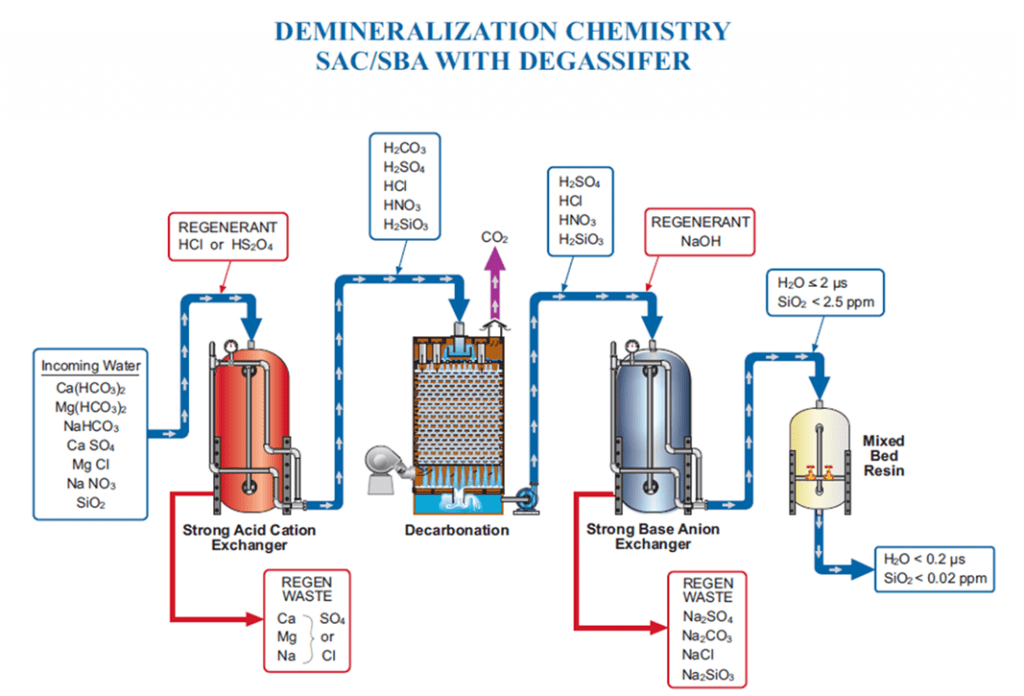
Inlet water is full of ions: cations such as calcium, magnesium, sodium, and potassium, and anions such as phosphate, alkalinity, sulfate, chloride, nitrate, and silica. Demineralizer systems remove these ions from water intended for high-purity processes.
Cations are first removed from the water in the cation unit. Hydrogen ions are exchanged from the resin beads for the cations in the inflowing water, lowering pH. The remaining anions combine with hydrogen ions to form their corresponding acids and hydrogen sulfide (H2S) if present.
The water then passes through a degassifier to strip carbon dioxide (CO2) from the water and expel it to help reduce anionic loading to the anion unit.
Finally, the anion unit removes anions from the water through ion exchange, releasing hydroxide ions into the anion stream. Water coming out of the anion unit will be relatively pure, likely under 2 µS conductivity, and contain only low levels of sodium and silica. Some applications, particularly high-pressure boilers, may need to run the water through a mixed bed polisher for further treatment.
Two Primary Demineralizer Issues
1. Short Runs
A short run indicates low throughput. The quality of the produced water can be acceptable, but conductivity and/or silica breakthrough occurs early, and the system produces fewer gallons of process water between regenerations.
2. High Leakage
High leakage refers to worsening water quality throughout the service cycle. This could include higher sodium or silica levels, depending on the cause.
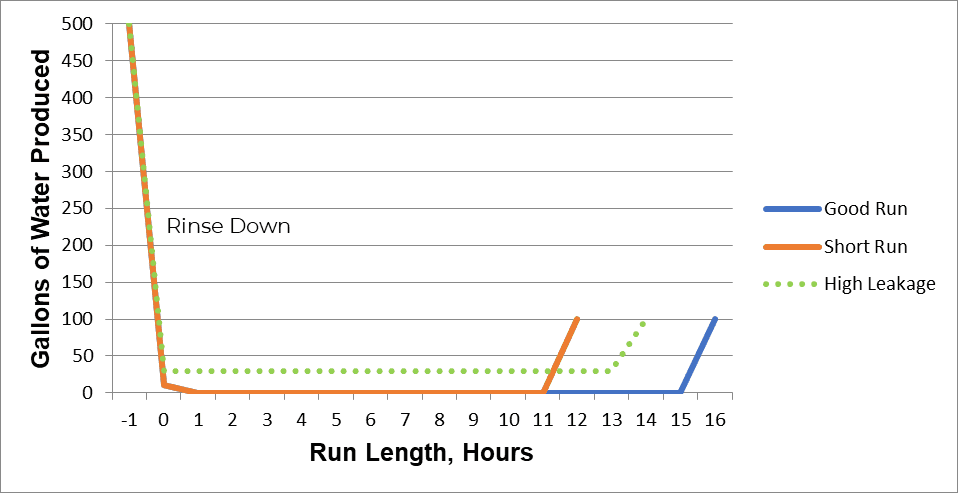
Demineralizer Troubleshooting Best Practices
The Importance of Keeping Records
Recordkeeping is a key component of troubleshooting demineralizers. Trending key metrics lays the groundwork for diagnosing system issues.
At a minimum, we recommend keeping track of the following data:
- Run length after every regeneration: how many gallons of water are produced on a given train between regenerations.
- Rinse length time: how long anion units or mixed beds take to rinse down to spec.
- pH and conductivity of the raw water, cation effluent, and anion effluent.
- Regular silica analysis of anion effluent: investing in on-line sodium or silica analyzers can be a great way to troubleshoot system issues.
- Annual resin analysis: Send core samples to an analytical laboratory to help determine what may be contributing to resin fouling (e.g., organics or silt).
- Quarterly source water samples. Source waters can change, particularly rivers and surface water, so we recommend regularly monitoring samples to track any shifts in water composition.
- Annual vessel inspection to ensure vessel internals are in good shape, laterals and screens are intact, etc.
Troubleshooting Short Runs
Changes in Feedwater Quality
Feedwater quality can vary over the course of the year. A demineralizer system is designed for a set number of ions, and conductivity changes will impact the system throughput.
For the sake of simplicity, water with 100 µS conductivity has about half as many ions as water with 200 µS. Therefore, a demineralizer processing water with 200 µS conductivity will have approximately half the throughput of a system processing water with a conductivity of 100 µS. This shift in throughput can be mistakenly interpreted as a short run, but it does not actually indicate a problem in the system.
Low source water conductivity can often mask poor resin performance because the throughputs are longer. As the conductivity increases, it can cause potential performance issues, so ensuring proper demineralizer operation is important to maintaining system health.
Resin Loss
Resin loss leads to reduced water production, causing short runs. It may be triggered by backwashing at too high a flow rate, which lifts resin and solids out of the unit.
We recommend checking resin levels every time the vessel is opened. Resin levels should be approximately 6 inches below your regenerant distributor (check schematics to confirm the position of the regenerant laterals). If resin is lost, it has to go somewhere: check where the backwash discharges to determine if any resin has been lost.
Seasonal Backwash Rates
Water density varies with temperature (cold water is denser than warm water), so backwash rates may need to change with the seasons. A single, set backwash flow rate could starve the demineralizer in the summer or provide excess flow in winter. Depending on where your facility is located, the ideal backwash flow for the summer months may be much higher than what is required for winter. The ideal backwash for most resins is 50% bed expansion.
Fouling
When backwashing does not occur as needed, solids from the feedwater build up in the resin, causing mud or silt fouling, also known as total suspended solids (TSS) fouling. Fouling can also be caused by issues with an upstream clarifier. In general, influent water to cation units should have no more than 5 Ntu of TSS.
Mud fouling can be treated by:
- Extending the backwash or increasing the backwash flow rate to expand the bed as much as possible without losing resin.
- Air scouring or using an air lance to break up clumps of mud in the bed before backwashing.
- Applying surfactants to clean resin (typically while equipment is off-line).
Channeling
Solids and silt fouling can lead to channeling, the preferential flow through a portion of the resin bed. When mud or silt and solids foul a resin bed, water will flow through the path of least resistance, creating large canyons or cracks. Insufficient backwashing is a major cause of channeling.
To test for channeling, perform a manual regeneration and let the unit backwash. After backwashing, skip all other regeneration steps until the fast rinse. If your water quality returns, your bed was channeled, and the resin may need to be cleaned.
A Quick Note about Packed Beds
Packed bed demineralizers make excellent quality water with lower leakage than co-current regenerated units. However, the resin is packed between two plates in these vessels, leaving no room for it to expand during backwash to remove solids. Packed beds require external backwash tanks where resin can be removed from the service vessel to be fluffed and cleaned of solids every 1–4 months. If your system does not have a backwash tank, ensure your feedwater is high quality, with a target Silt-Density Index (SDI) of less than 5.
Resin Degradation
Chemical Damage: Resin can chemically degrade, causing short runs and higher leakage. If a free chlorine residual is carried from the front of the plant through the clarifier to the demineralizer system, the cation resin becomes susceptible to chlorine damage. Dechlorinating water before it enters the cation units is best practice for mitigating this issue.
Temperature Damage: Anion resin is susceptible to damage caused by high temperatures. Styrenic resins have a temperature limit of 140°F (for Type I resin) or 95–105°F (for Type II resin). Acrylic resins have a temperature limit of approximately 90–95°F. Be aware of these limits and monitor the ambient temperature of influent water as caustic is heated for regeneration.
Troubleshooting Increased Leakage
Poor Regenerations
One major cause of short runs and high leakage is poor regeneration. Units are designed for a set amount of acid and caustic feed. If acid or caustic is underfed during a regeneration, this can result in both short runs and higher leakage. Acid and caustic must be fed at the correct dosages and concentrations.
Sulfuric acid is typically fed at 4-10 lbs. of acid per cubic foot of resin, and caustic is fed at 3–8 lbs. per cubic foot of anion resin. The recommended concentrations are 1–5% for acid and approximately 4% for caustic.
Troubleshooting with Elution Studies
Elution studies measure regenerant concentrations in and out of the vessel with a hydrometer to determine the concentration. Regenerant values out of the vessel should slowly approach the concentration going into the vessel.
Important Note: When conducting the hydrometer measurement, temperature should also be measured, as it will increase during the exothermic reaction of acid and caustic. The hydrometer reading will need to be corrected with the use of a temperature compensation chart.
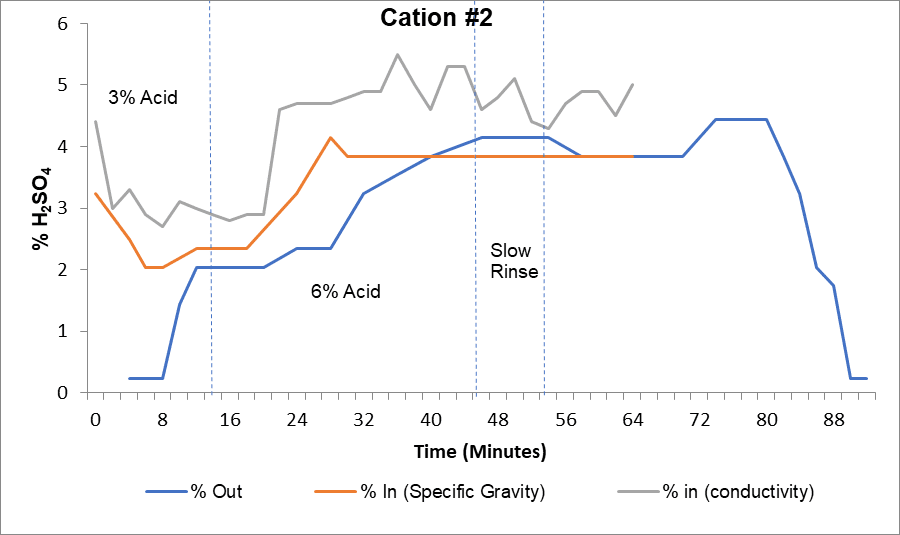
The curve above provides an example of elution study results for a cation unit. The gray line represents the percent acid into the cation unit measured by a high-range conductivity meter. The orange line represents the percent acid measured by a hydrometer, and the blue line shows percent acid coming out of the vessel.
This regeneration required a 3% acid step and a 6% acid step. The high-range conductivity probe showed target acid concentrations were being reached, but manual hydrometer sampling indicated that acid was underfed by at least 1% in each step. After calibrating the conductivity meter, the plant achieved proper operational levels.
Hardness Fouling in Cation Resin
Hardness fouling occurs when hardness precipitates as calcium sulfate in the resin bed, causing high leakage and short runs. When using sulfuric acid, it is important to pay close attention to the acid concentration in the system. Sulfuric acid regeneration causes calcium and barium from the resin to react with the sulfates to form and precipitate calcium sulfate (gypsum). Step-wise acid addition can prevent hardness precipitation.
Starting at a lower acid concentration, feed 1–2% sulfuric acid to regenerate the bed, then increase the concentration to 2–5% to achieve good regeneration without the risk of calcium sulfate precipitation. Proper acid concentrations for step-wise acid addition should always be calculated; always consult your resin manufacturer prior to changing acid concentrations.
Troubleshooting
Calcium sulfate precipitation will appear as white, snowy flakes in the acid outlet sample. This indicates one of two things:
1. The dilution flow rate is too slow, or
2. The first step acid injection is too high (potential hardness fouling in the resin bed)
Organic Fouling
Organic fouling is a common issue for demineralizers, particularly in systems that use surface water for makeup. It causes long anion rinse times and shorter runs.
Troubleshooting with Anion Unit Elution Studies
If you suspect your system is fouled with organics, monitor the outlet color during caustic injection. If it darkens to a tea-like color, approaching 8–12 on the VCS scale, the anion resin is probably organically fouled.
What Causes Organic Fouling?
Surface waters are loaded with tannins and lignins, which are long-chain organic acid molecules. Negatively charged, these molecules behave like anions in the feedwater and will attach to the anion resin. Once bound to positively charged functional groups on the anion resin, the long chain molecules get wrapped up in the resin and block other ion exchange sites.
When caustic is added during regeneration, sodium ions bond to the remaining sites on the negatively charged organic chain molecules. These will slowly elute off during the fast rinse and extend rinse times. As a result, long rinse times are also a good indicator of organic fouling.
Note: The removal of organics from the anion resin will not be 100% effective. Typically, the percentage of remaining organics in Type I resin is 70%. Over time, these organics accumulate, and a caustic brine squeeze will need to be performed to remove them.
Treating Organic Fouling: Caustic Brine Squeeze
A caustic brine squeeze is a preventative method for anion resin organic fouling.
For influent water with high organics, such as river water, a caustic brine squeeze may need to occur at least 2–4 times a year.
Caustic Brine Squeeze Procedure
(This is a brief overview of the procedure; consult with your water treatment provider before performing a caustic brine squeeze to ensure all necessary steps are taken.)
1. Inject 2–3% caustic at 95°F for 20 minutes, then flush the caustic from the unit
2. Inject with 8–10% brine or sodium chloride and soak the resin for 40 minutes
3. Repeat this process until the color of the cleaning solution lightens to a tea-like color
Iron Fouling
Iron can foul cation resin, resulting in short runs. High iron concentrations associated with well water, ferric chloride, or ferric sulfate use can result in iron precipitation in the resin bed. Iron fouling is fairly easy to detect with an off-site resin sample evaluation. Samples should be taken every time a vessel is open and at least once per year.
Iron-fouled systems can be treated with iron cleaners such as ChemTreat’s RL2016.
Coagulant Fouling
Coagulants that can foul cation resin include DADMAC or organic coagulants like polyamine. Organic coagulants have a high positive charge and a high molecular weight. The positive charge will attach to cation resin and bind, essentially irreversibly. DADMAC dosage must be strictly controlled because DADMAC fouling is also often irreversible and overfeed can foul the cation resin downstream.
DADMAC fouling causes a “plastic bag” effect, as if a plastic bag were caught up in the resin, preventing larger ions from moving through the bed and causing hardness leakage. If coagulant fouling is suspected, the methylene blue dye test can be run on a sample sent off-site. The off-site laboratory test will evaluate whether the resin uptakes the dye, which would indicate coagulant fouling.
Internal Vessel Inspections
It is best practice to inspect vessel internals annually. During these inspections, a core resin sample should be taken, and the following items noted:
Internal lining
- Is it intact? Or is it cracked or bubbled?
- Is there slime or biological fouling present?
- Is there a brown (iron) or white (calcium) coating along the inside?
Distributors
- Are the laterals and distributors even?
- Are spray hole orientations correct?
- Are screen wrappings intact?
- Is corrosion occurring?
The top of the resin bed
- Are solids obvious and present?
- Is there channeling in the bed?
- Are any oily substances on the bed?
- Mark the height of the resin; does resin need to be added?
Does the shape of the bed have an even, flat top?
Decarbonator Problems
Decarbonators tend to be neglected more frequently than demineralizers. These systems remove CO2 and H2S, and, if functioning improperly, will cause short runs. If a decarbonator issue is suspected, check the CO2 concentrations in and out of the unit to determine the efficiency of CO2 removal.
Decarbonators act like giant air scrubbers. If their filters are failing or pulling in dirty air, they can contribute to downstream anion unit fouling. Additional problems can include incorrect spray distribution, improper air flow, and a collapsed or biologically fouled packing element.
Three Things to Look for when Troubleshooting Mixed Bed Issues
Mixed beds should be rinsed down to approximately 0.1 or 0.2 µS within an hour. A longer rinse time indicates a problem with the system. In these cases, there are three main things to check.
1. Incomplete separation of cation and anion resin after backwash: There should be a clear, sharp separation between the two resins. If the separation is poor, cross-contamination may occur during regeneration, causing extended rinse downtime.
2. Poor mix step: Air flow during the mix step should be violent and achieve target air flow.
3. Failure to properly drain: The bed should be drained down before the mix to the correct level. If draining too high or too low, a good mix will not occur.
Need Help Troubleshooting Your Demineralizers?
ChemTreat is here to help you troubleshoot your demineralizers and associated water systems. We can help you analyze the resin, and our technical experts and local team can pinpoint issues and create a treatment plan best suited to the needs of your facility.
As with all other technologies, due diligence is necessary to determine the feasibility for utilizing these methods. It is always important to consult your equipment manuals and guides and seek guidance from your local water treatment representative to address your specific needs.

The post A Guide for Troubleshooting and Treating Demineralizers appeared first on ChemTreat, Inc..
]]>The post A Practical Guide to Sustainable Cooling Practices for Data Centers appeared first on ChemTreat, Inc..
]]>Sustainability is the quality of not being harmful to the environment or depleting natural resources, thereby supporting long-term ecological balance. Avoiding waste, non-renewable resources, and pollution, and conserving resources are all actions used to support sustainability initiatives.
In 2022, data center spending and expansion will hit $200 billion. According to a Gartner® report, data centers are making the greatest investments in the following areas to support sustainability and cut operating costs.
1. More Efficient Use of Space
- Serverless computing: More companies are utilizing cloud services instead of building their own servers.
- Colocation: Large data centers are being built to house servers for multiple businesses using more modern, efficient systems.
2. Edge Computing
Adding equipment directly to the environment where data is being generated. This includes the Internet of Things (IoT), which connects some 80–85 billion smart devices to the internet.
3. Artificial Intelligence (AI)
Increased investment in AI to manage how computing is performed.
4. Green, Sustainable Technologies
Initiatives and improvements to reduce energy and water use and minimize carbon footprint.
Proper cooling water treatment can effectively help data centers support sustainability initiatives by reducing water and electrical use. However, it is important to first understand why cooling is essential to data center operation and how it impacts water and energy consumption.
Cooling Data Centers: Why do Data Centers Require Cooling?
As data centers run power to their equipment, they generate waste heat that hinders equipment effectiveness. CPUs that are not cooled properly will not run efficiently, and overheated CPUs can shut down a server.
Where is Power being Used?
- Cooling IT equipment
- Service operation and data storage
- Network infrastructure or hardware
- General operating costs (“keeping the lights on”)
Servers
As electricity flows through a CPU, flipping the transistors off and on, it generates waste heat. A server blade can generate anywhere from 2,000–4,000 BTUs per hour.
CRACs vs. CRAHs
Heat is removed from a data center through computer room air handlers (CRAHs), computer room air conditioners (CRACs), and traditional air ducts. A CRAC has a built-in direct expansion unit. Like any other conditioner, it uses a refrigerant that removes heat from the CPU to cool the unit. Older CRAC models operate less effectively, turning off and on as needed. Newer units have a modulated compressor so they can scale up as cooling needs increase.
Air handlers are very effective for cooling. They operate by blowing warm air from the facility over a coil filled with chilled water typically supplied by a chilled water plant. CRAHs can have variable frequency drives that modulate the fan or the pumping speed so only the required amount of electricity is consumed to remove heat from the facility.
Existing data centers can reduce energy usage by optimizing the cooling process for air handling and cooling water. Utilizing evaporative cooling, for example, can reduce electrical consumption because it can remove the same amount of heat as chillers while using less power. It is much less electrically consumptive than a compressor and a fan. Evaporative cooling also requires less energy than a heat pump.
Waste heat can also be captured and recycled. For instance, an Amazon facility in Seattle uses their waste heat to warm a nearby biosphere project.
Data Center Sustainability Metrics
The Green Grid was formed by a group of data centers that recognized the high level of energy consumption in their industry and developed a set of metrics for monitoring power usage and electricity consumption: Power Usage Effectiveness, sometimes referred to as efficiency, and Data Center Infrastructure Efficiency. Related metrics include Carbon Usage Effectiveness and Water Usage Effectiveness.
Power Usage Effectiveness (PUE)
PUE is a measure of how much of the total facility power is consumed by IT equipment power use. It is calculated using the following equation:
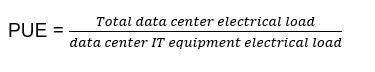
An average data center PUE is approximately 2.5, but a very efficient data center may have a PUE of less than 1.6.
Data Center Infrastructure Efficiency (DCIE)
DCIE is the percent of IT power used in relation to the total energy consumed by the facility. It is calculated as the inverse of PUE. A PUE of 2.5 is equivalent to 40% DCIE.
Carbon Usage Effectiveness (CUE)
CUE measures the carbon gas emitted by a data center daily and is related to the amount of electricity a data center consumes. 40% of the electricity in the US is generated through clean or green methods, while 60% is being generated by fossil fuels. Therefore, reducing the energy consumed at a data center also reduces carbon dioxide emissions for the power generation needed to keep the data center running.
Water Usage Effectiveness (WUE)
WUE measures how much water a facility uses for cooling and other building needs.
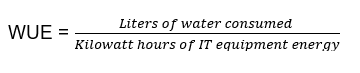
WUE is an important metric to track for data centers looking to improve on-site sustainability. Reducing or reusing water used for data center processes can help you meet environmental goals while simultaneously realizing cost savings.
Achieving Sustainability Goals for Existing Data Centers
Case Study: Chemical Cleaning Impact on PUE
A small 2.3 mW data center in the southeast US had an annual spend of approximately $1.3 million. Cooling accounted for 1.035 mW of the power load and PUE was calculated at 2.5.
ChemTreat performed a chemical cleaning of the cooling system to reduce scale, lowering PUE by 0.12 and resulting in a 10% efficiency gain. By lowering the electrical load needed to run the system, related carbon dioxide emissions were also reduced, resulting in an annual electrical savings of $59,000. This easily covered the expense of the chemical cleaning.
The table below shows how scale impacts energy efficiency.
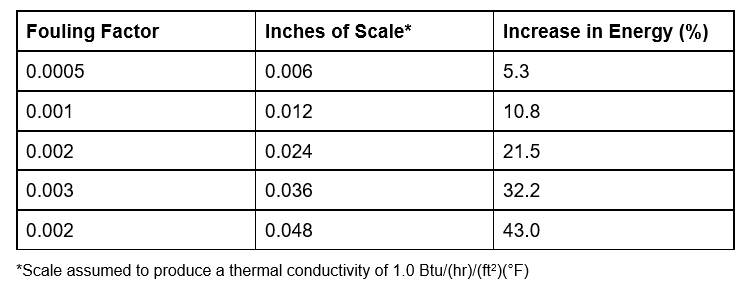
Results are examples only. They are not guaranteed. Actual results may vary.
Direct Liquid Cooling and PUE
One very effective way to cool data center processors is direct liquid cooling, the process of submerging the processor computer board in a liquid. Allied Control was able to achieve a PUE of 1.02 in 2015 with a non-conductive dielectric fluid, reducing cooling power consumption by 95% and overall facility power consumption by 50%.
Previously, using thermoelectric fluids was problematic because many were toxic. However, Allied was able to produce an environmentally friendly fluid for their system.
Similarly, Microsoft achieved a PUE of 1.07 by submersing a data center in the ocean. To prevent accumulation of ocean particles and reef material (which could cause a potential increase in electrical consumption), high-velocity cooling pumps were used to stop sea life from attaching to and proliferating in the cooling channels.
Improving CUE Through Data Center Design
- Location sourcing: Data centers in cooler environments have fewer energy needs than facilities in hot environments. It is easier to eject heat from a data center into the atmosphere in a cooler climate. Air-cooled condensers in cooler environments also require less water. Intelligent management of cooling sources for ejecting heat to the atmosphere can be a very effective method for reducing power usage. In cool environments, data centers that exchange warm interior air with cool outside air often utilize steam humidifiers. Ultrasonic humidification reduces energy use because steam adds heat to the environment, resulting in higher cooling rates. Converting to ultrasonic humidification can save over 80% of the humidifying and conditioning spend.
- Upgrading equipment: Energy reduction can be achieved by replacing old servers with newer, low-power servers for more efficient processing and replacing spinning hard drives with solid-state hard drives. Spinning hard drives consume more electricity and generate waste heat.
- AI and Virtualization (Software Improvements): AI can optimize CPUs and allow some units to idle while focusing data processing on active CPUs. Additionally, through virtualization, a single server blade can operate an entire virtual machine, increasing CPU utilization by 40–60% and eliminating idle processors. Virtualization on 100 servers would be the equivalent of planting over 1,500 trees or taking 89 cars off the street in terms of carbon removal.
Improving WUE Through Effective Water Treatment
WUE can be improved by using effective water treatment to mitigate corrosion, deposition, and biofouling issues. A system free of deposition, biofouling, and corrosion uses less energy and water.
Utilizing High-Quality Water Sources
WUE can be impacted by geographic region and weather. For example, local water sources may contain high levels of dissolved minerals. Reverse osmosis (RO) can improve water consumption in such environments by generating high-quality makeup water for cooling systems that do not contain the minerals that would otherwise concentrate in the cooling water.
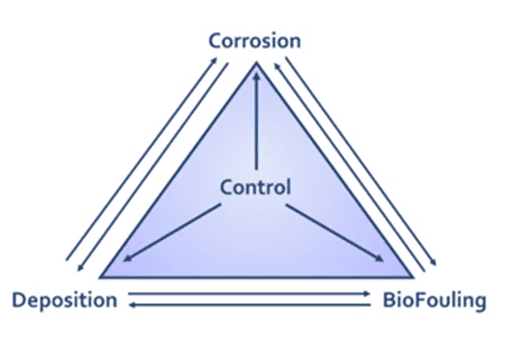
Applying Chemical Inhibitors
The water treatment triangle above illustrates the interconnectedness of corrosion, biofouling, and deposition. Microorganisms can create biofouling, which leads to corrosion and deposition. Biofouling deposition is some of the most insulative deposition cooling systems can experience. Applying chemical water treatment inhibitors helps reduce these effects, which can negatively impact data center equipment life, efficiency, and productivity.
Reducing Unnecessary Downtime
Approximately 20% of data center outages are directly related to cooling system failures, including IT and water-cooling equipment. For a 10-mW data center, the downtime required to treat water system issues, such as excess scale or fouled equipment, can cost as much as $5,600 per minute or up to half a million dollars per incident. Proper water treatment is an important component of maintaining reliable operation and keeping costs low.
Additional Sustainability Metrics and Improvements
In addition to reducing energy, power, and water consumption, electronic disposal efficiency should be considered. This includes material disposal such as the percentage of decommissioned electronics and equipment recycled.
The data center productivity (DCP) metric looks directly at the quality of data center processing versus the work used to achieve it.
- Data centers can buy renewable energy certificates (REC), similar to carbon credits, to offset their carbon footprint.
- Other ways to improve this metric include:
- Switching out fluorescent lighting for LEDs. LEDs produce less heat, and every generation of LEDs has increased efficiency and greater light quality.
- Investing in weatherproofing and proper building maintenance, upgrading insulation and facilities as needed. Facilities in northern environments could use some degree of free air cooling and ventilation during the winter months for cooling processes.
- Installing low-flow taps and toilets to reduce water usage. Catching rainwater and condensation from air conditioners is also very useful for reducing water consumption. These two sources produce very pure water, so not much pretreatment is typically needed for reuse directly in a cooling system.
- Contributing to the Arbor Day Foundation and planting trees or donating time can offset carbon output.
- It is recommended that older refrigerant R22 be phased out and replaced with modern refrigerants, as R22 contributes to greenhouse gas emissions.
Sustainability Considerations for New Data Centers
Data Center Construction: Commissioning a Data Center
Considering water treatment when commissioning a new data center is important for preserving proper equipment operation and longevity. Nearly 70% of early equipment failure can be traced back to design, installation, or setup deficiencies. Preoperational cooling system treatment can impact the reliability and duty life of those systems.
In the construction timeline, it is wise to consult with water treaters as early as the design phase. Without water treatment knowledge, procurement may make decisions that aren’t optimal for operating cooling systems in the long run. For example, selecting a galvanized steel sump for a 250-ton cooling tower would save $4,000–$5,000 over one made of stainless steel. However, galvanized steel is much more reactive than stainless steel, can be more expensive to treat, and would likely need to be replaced sooner.
At the latest, water treatment experts should be brought in during the acceptance or contractor testing phase because construction companies or contractors will often add water to hydrotest equipment but rarely use the necessary inhibitors or biocides.
When contractors hydrotest equipment with untreated water, it will often be left stagnant until the facility is brought on-line. The stagnant water can cause corrosion and microbial blooms. If left stagnant for more than 1–2 weeks, a special chemistry will need to be applied. Otherwise, when the data center comes on-line, the water may be rusty orange and full of iron particulate, making it difficult to achieve a good start-up phase because initial testing will be impacted by the water’s impaired quality.
Prepping a New System
New equipment must be cleaned and degreased prior to operation to remove rust preventatives and oil or grease used to cut threaded joints, etc. to reduce bacteria on surfaces. Many of the materials present in new equipment are organic and can act as food for bacteria and bugs, increasing corrosion potential.
Passivating cooling surfaces is also important for helping protect copper, brass, and steel equipment from corrosion by developing a protective metal oxide coating on water-contacting equipment.
To remediate poor startup practices, ChemTreat utilizes programs without corrosive acids to pull rust from the surface without dissolving the equipment’s base metal. Microbial contamination is cleaned with hydrogen peroxide-based products that degrade into the base compounds of oxygen and water.
Mitigating Poor Pre-Operation Results: Cooling System Cleaning Case Study
Mineral scale in a cooling system was impairing flow and prevented adequate cooling. ChemTreat used a thermal infrared camera to check the water flow and temperature. Cleaning chemicals were applied, successfully increasing flow and cooling efficiency.
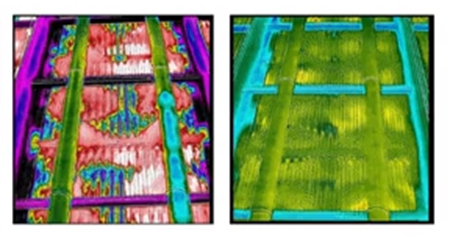
Thermal Images Pre-Cleaning (left) and Post-Cleaning (right)
Results are examples only. They are not guaranteed. Actual results may vary.
Building Sustainably
Citigroup built a data center using locally sourced and recycled materials to minimize the carbon footprint of construction. Vegetation was incorporated into a wall and the roof to help insulate against heat and open windowpanes were added to provide daylight and natural ventilation.
As a result, this facility uses 30% of the power typically required for a data center of the same size, and 40% of typical heating energy. The RO system saves them approximately 13 million gallons of water per year. This facility was awarded the very first Platinum Leadership in Energy and Environmental Design (LEED) certification.
Treating Data Centers
Treating Redundancies: Idle Systems
Data center redundancies include backup equipment that sits idle in case of issues with the primary equipment. Backup equipment generally holds stagnant water, making it prone to pitting corrosion and microbial growth because inhibitors are not regularly flowing. These systems may require extra care and treatment as water sits on the metal surface and promotes corrosion. The rate of equipment wastage can increase over time as the concentration of corrosion byproducts builds up in the stagnant water, depleting existing inhibitors.
Microbial blooms can also occur because rinsing and replenishment of biocides and inhibitors is not taking place in idle systems. Without adequate layup treatment, the corrosion rate can increase 5–50-fold in stagnant systems, and microorganisms can proliferate and create substantial biofouling during that downtime.
Treatment Overview
Inhibitor Applications
Inhibitors are a common, reliable treatment solution for data centers. However, not all are environmentally friendly, and some phosphate- and zinc-based chemicals are even restricted in certain geographies, causing many data centers to seek phosphate-free options. ChemTreat offers non-phosphate and non-zinc corrosion inhibitor options as part of our FlexPro® product line.
Bacteria Inhibitors: Biocides
Biocide applications usually contain bleach or chlorine to control bacteria. Halogen programs are also available with combination programs of bleach and bromine, which can be less corrosive than bleach alone.
Corrosion Inhibitors
Corrosion inhibitors in closed loops are another standard application in data centers. These include nitrites, azoles for protecting yellow metals, borax-buffered products, and molybdenum.
Scale Inhibitor
Phosphonates and polymers are used in evaporative cooling towers to help prevent mineral scale through crystal modification.
Deposition Inhibitor
Polymer-based deposition inhibitors are applied to help prevent the settling of suspended solids. Open recirculating cooling towers are particularly prone to suspended solids issues. For instance, if a cooling tower is in an area where construction is taking place, the dust and debris in the air can travel into the open system and build up in the cooling water.
Pretreatment/Suspended Solids Treatment
Reverse osmosis can be used to remove minerals from makeup water, which can conserve water by reducing minerals building up in concentration and decreasing the saturation of minerals in the water. This reduces the tendency to form scale and insulate heat exchange surfaces.
Treatment Concerns: Equipment
Data center cooling equipment is generally highly efficient. However, efficiency does not guarantee equipment longevity.
High-efficiency heat exchanger tubes, for example, have very thin walls, and most are rifled to create turbulent flow for more efficient heat transfer. Thin walls allow for high heat transfer rates since the heat does not have to travel through much material. Raw material costs are also lower because there is less material used in construction and the lower weight reduces transportation costs.
However, the thin material does not leave much room for corrosion. Rifles in the metal surface can capture debris from the cooling water and cause corrosion sites and areas for bacteria to proliferate and cause fouling, greatly decreasing equipment efficiency.
Unique Equipment Options
Munters
Evaporative cooling is often preferred to chillers in data center cooling applications to improve PUE. Munters is a premier vendor/manufacturer of smaller evaporative coolers often employed by data centers. They manufacture a unique adiabatic media for use in their products.
Their core system, the Oasis® direct evaporative cooling system, is an intelligent cooler that can cool a data center using outdoor air through a heat exchanger without mixing hot and cold air.
An indoor data center can be chilled by blowing cold outdoor air across the heat exchanger. Should the outside air be too hot, Oasis will switch to an evaporation system where condensation takes place inside the tubes. With the indoor air in the evaporative systems, up to a 70% approach to the wet bulb temperature can be achieved. This can produce cooling fluid or cold air inside the data center that is colder than the ambient outdoor air temperature. The Oasis unit can achieve annual PUEs as low as 1.12–1.15. However, it requires very high-quality makeup water, so pretreatment is required, typically with an RO system.
Vertiv Liebert
Previously Emerson Liebert, Vertiv Liebert® offers high-efficiency cooling systems. Like the Munters Oasis unit, this system can change its method of ejecting heat to the atmosphere based on the weather.
The systems can utilize evaporative cooling; exchange interior warmer air directly with air outside the facility; or use a chill loop to pull water through a heat exchanger, ensuring it remains above the dew point so condensation does not occur. These units are capable of achieving PUE lower than 1.1.
Adiabatic Media Concerns
Munters media typically lasts approximately 3–4 years before it has to be replaced. It is susceptible to fouling; reverse osmosis water or very high-quality makeup water is recommended to optimize the equipment’s longevity.
Not very many inhibitors or biocides are approved to be used with this media. The ChemTreat R&D group is currently working on developing a product line to help increase the life of this media by 20–25%.
Product Monitoring Technology
Ensuring water chemistry inhibitors are within the correct parameters is a critical component of reliably operating high-performance cooling equipment. Previously, periodic grab sample testing was performed to monitor product concentrations. Now, systems utilize real-time control using on-line monitoring.
ChemTreat has developed a line of products that use fluorescence monitored with electronic sensors. These do not require reagent use, reducing costs associated with on-line analyzers that operate pumps and gears to add reagent chemistry and take measurements.
Fluorescence measurements can be done in-line or with handheld devices and do not require any sample conditioning. This eliminates the downtime needed for running wet testing as well as the need to handle and dispose of test reagent chemistry, which can be toxic.
The on-line monitors can be automated to send information to data logger systems, allowing authorized personnel to view data in real time and use it to make informed decisions on cooling system changes.
Automation Investment
Automation can reduce chemical consumption because manual control usually results in higher than necessary chemical levels. By continuously monitoring water systems, daily chemical requirements can be better understood, and water consumption can be reduced by running at a lower saturation.
This improves program performance all-around, reduces the manpower needed for monitoring cooling systems, and provides valuable data for troubleshooting. Often, the chemistry and water savings can help pay for the upgrade and equipment for real-time monitoring and automation.
Case Study: FlexPro + ClO2 + Automation
A large data center was experiencing failures in their new air handlers less than three years into operation. The cause was determined to be poor water quality in an old thermal energy storage (TES) system attached to the cooling system air handlers.
The TES system contained a lot of debris and suspended solids. The system was not automated, and the microbiological program was poorly managed. When ChemTreat was called in to remediate the system, chemicals were applied to clean surfaces and automation implemented.
ChemTreat’s low-nutrient FlexPro program lowered the tendency for bacterial growth in the system. Chlorine dioxide was also applied to inhibit bacteria growth.
After cleaning the system and installing automation technology, the data center began monitoring bacteria counts daily, and the site is now looking at implementing on-line ATP analyzers, which can determine how much bacteria is in the water at any given minute.
This facility no longer has issues achieving their cooling goals, and they have not experienced a single CRAH failure since implementing ChemTreat’s recommendations.
Results are examples only. They are not guaranteed. Actual results may vary.
The Future of Sustainability in Data Center Operations
Going Green
Data centers have come a long way in improving their energy and water consumption and carbon emissions per data output, but further investment in infrastructure and other improvements are still being implemented. These improvements can often lower operating costs.
Impact of Sustainability Efforts on Future Developments
Many large mega cap companies are pledging to be carbon neutral in coming years, or even to running on 100% sustainable energy. This will likely drive the sustainable energy industry, bringing down prices for projects like windmill construction and solar panel manufacturing, increasing access to renewable energy generation in the future.
ChemTreat is ready to help your data center on its sustainability journey. Request a consultation today and partner with us so we can help you achieve your environmental goals around water and energy consumption reduction.
As with all other technologies, due diligence is necessary to determine feasibility for utilizing these methods. It is always important to consult your equipment manuals and guides and seek guidance from your local water treatment representative to address your specific needs.
The post A Practical Guide to Sustainable Cooling Practices for Data Centers appeared first on ChemTreat, Inc..
]]>The post Data Center Efficiency and Sustainability Part 3: A Winning Water Treatment Strategy for Data Centers appeared first on ChemTreat, Inc..
]]>However, simply adding chemistry to cooling water systems is not enough. Creating a water treatment program that protects heat exchange efficiency and minimizes water usage takes a holistic approach.
1. Align Your Water Treatment Programs to Sustainability Targets
Data centers rely on a lean staff, so it is critical to have a water treatment partner to act as a part of your team and run programs to achieve your PUE, WUE, and sustainability targets.
2. Sync Chemical Feed Programs with Maintenance Schedules
Water treaters should communicate with data center operators regularly to ensure chemical feed programs align with preventative maintenance circulation schedules.
3. Establish a Cadence for Regular Water Testing and Analysis
Regular water testing may include things like mineral balances and laboratory bacteria analysis to look for indicators of scaling and biofilm formation before they become insurmountable challenges.
A water treatment program that uses a reactionary strategy will end up costing more in labor, chemistry, equipment years, and downtime compared to a program that uses a consistent and proactive approach.
How ChemTreat Can Help
ChemTreat is here to help you manage your water treatment program efficiently. We have assembled a highly experienced team ready to help you implement a water treatment program customized to your unique system needs.

The ChemTreat team can help your facility develop a winning water treatment strategy.
Our programs may include:
- Alignment of chemical feed programs with preventative maintenance circulation schedules
- Regular water testing for scaling and biofilm indicators
- System alert implementation to monitor critical control parameters
- A holistic approach aligning the water treatment program with the operational nuances of your facility
Free Sustainability Report
Want to know where you can make the most impact in improving PUE? ChemTreat is offering a free sustainability assessment and report to help you identify where and how you’re using water and power. We can also offer key recommendations to help you achieve your water and energy savings goals. Click the link below to claim your free report!

Of course, all systems are different, and due diligence is necessary to determine the feasibility for utilizing these methods. Always consult your equipment manuals and guides.

The post Data Center Efficiency and Sustainability Part 3: A Winning Water Treatment Strategy for Data Centers appeared first on ChemTreat, Inc..
]]>The post Data Center Efficiency and Sustainability Part 2: The High Costs of Inefficient Heat Exchange appeared first on ChemTreat, Inc..
]]>Data centers use an estimated 2% of power in the US, but there has not been an ideal model for assessing energy efficiency because of rapidly evolving data center designs. Rack densities in modern data facilities can range from 40 to 500 W/ft2 and result in uneven heat load, making typical commercial building energy modeling a poor fit. Furthermore, IT equipment, cooling, and HVAC equipment are not always evolving at the same rate.
Operators measure power usage effectiveness (PUE) as one way to control energy consumption at their facilities.
The Threat of Biofilm to Heat Exchange Efficiency
Operators can sometimes overlook the impact that improper water treatment can have on energy consumption. Microbiological fouling in water-side heat exchange and chilled water systems can be the culprit that makes or breaks a site’s PUE and sustainability targets.
On water-side heat exchange surfaces, fouling will not only result in much higher energy consumption because of poor heat exchange efficiency, but often shorten the lifespan of the heat exchange equipment itself.
Microbiological fouling can also be a huge issue in chilled water systems, especially when large thermal storage tanks are used. Proper microbiological control is often overlooked in this area because the chilled water is thought of as a “closed” system. However, the low flow in the tank creates an area ripe for sediment to settle, promoting bacteria and biofilm growth.
The High Costs of Inefficient Heat Exchange
When biofilm spreads and establishes itself on heat exchange surfaces, it will significantly inhibit heat exchange efficiency. Whereas the thermal conductivity of copper, aluminum, and stainless steel are 384.0, 138.5, and 16.3 W/mK respectively, the thermal conductivity of biofilm averages 0.65 W/mK1. A biofilm layer reducing tube diameter by 10% would reduce heat exchange by 55%.
In the language of operating costs, a 0.6mm-thick layer of biofilm on heat exchange surfaces of a 500-ton chiller would cost an additional $15,000 per year to operate.
Premature and unexpected equipment failure can be a threat to uptime and data center reliability. Chiller tube lifespan is drastically reduced by persistent microbiological issues. Taking the equipment off-line for retubing or replacement is neither cheap nor ideal for preserving redundancy. The same 500-ton chiller would cost nearly $125,000 to retube or $350,000 to fully replace.
A Little Prevention Goes a Long Way
Generation 5 data centers are steadily moving away from traditional chiller plant cooling systems, opting instead for more modular solutions designed to be more water- and energy-friendly.
These new generation cooling strategies still rely heavily on water for cooling and are not without their treatment challenges. Microbes still proliferate in these systems, and proper water pretreatment or preventative programs are necessary to preserve equipment life. Failing to implement an appropriate treatment strategy can lead to health hazards via waterborne pathogens and unnecessary early cooling media replacement. A little preventative maintenance can go a long way in new generation cooling systems.
Contact ChemTreat today for a consultation on preventative maintenance in your cooling systems. Our team has experience helping data center customers solve their water treatment challenges.
Always remember that all systems are different, and due diligent is necessary to determine the feasibility for utilizing these methods. Consult your equipment manuals and guides.
Free Sustainability Report
Want to know where you can make the most impact in improving PUE? ChemTreat is offering a free sustainability assessment and report to help you identify where and how you’re using water and power. We can also offer key recommendations to help you achieve your water and energy savings goals. Click the link below to claim your free report!
Citations:
1. Sun, K., Lui, N., Lui, X., Hong, T., “Prototype Energy Models for Data Centers”, Building Technology and Urban Systems Division Lawrence Berkeley National Laboratory, Jan 2021.
2. Biofouling: https://doi.org/10.1002/bit.260230902
3. EPRI- 2015 Cooling Tower Seminar
4. Crocker, Michael. Chiller Efficiency: A Calculator for Estimating the Cost of Condenser Fouling. http://innovastechnologies.com/chiller-efficiency-calculator-for-estimating-condenser-fouling-costs/
Cost estimate based on a 500-ton chiller with 3,000 annual operational hours and a $0.09/kWhr cost of electricity.
Additional Sources
1. Heslin, Kevin. Corporate Sustainability Seems Elusive: How Can It Help? https://www.7x24exchange.org/corporate-sustainability-seems-elusive-how-can-it-help/
2. Alliance to Save Energy, Incorporated, ICF, Incorporated, ERG, U.S. Environmental Protection Agency, Brown, Richard E, Brown, Richard, Masanet, Eric, Nordman, Bruce, Tschudi, Bill, Shehabi, Arman, Stanley, John, Koomey, Jonathan, Sartor, Dale, Chan, Peter, Loper, Joe, Capana, Steve, Hedman, Bruce, Duff, Rebecca, Haines, Evan, Sass, Danielle, & Fanara, Andrew. Report to Congress on Server and Data Center Energy Efficiency: Public Law 109-431. United States. https://doi.org/10.2172/929723
The post Data Center Efficiency and Sustainability Part 2: The High Costs of Inefficient Heat Exchange appeared first on ChemTreat, Inc..
]]>The post Data Center Efficiency and Sustainability Part 1: Reducing Excessive Water Usage appeared first on ChemTreat, Inc..
]]>Data center companies have been pledging to improve sustainable practices, but when it comes to water and energy conservation, they must work closely with their water treatment provider to achieve their ambitious goals.
It is important for the water treatment provider to have the necessary expertise to approach systems holistically and determine the best program to balance protecting equipment while realizing water and energy savings.
Part 1 of this three-part series on data center efficiency focuses on preventing excessive water usage.
Water Usage Efficiency (WUE)
Water-conscious data centers have adopted the water usage efficiency (WUE) metric to monitor and manage their water usage. One way data centers can improve WUE is to stay ahead of excessive water consumption, looking out for critical control parameters in their water treatment program.
Common Culprits of Excessive Water Consumption
Excessive water usage can come from several key areas:
- Unchecked cooling tower overflow
- Poor conductivity control
- Target cycles of concentration
Unchecked overflow or consistently running a cooling tower program at unnecessarily low cycles of concentration can cost a data center millions of gallons of water per year.
Consider a single 500-ton system running at an average annual load of 65%. Running the system at 2.0 cycles of concentration instead of a higher 3.0 cycles of concentration consumes an additional 1.94 million gallons of water per year*.
A key part of data center water treatment is to regularly analyze the incoming makeup water and set cooling tower program control ranges that minimize water consumption without putting the system at risk of scaling.
Setting Critical Control Parameters and Alerts
Data centers need water treatment programs designed with water conservation in mind, and it is important to communicate critical control parameters with water treatment partners regularly to mitigate excessive water usage.
Control ranges for water savings metrics such as conductivity and target cycles of concentration can be communicated to data center operators via regular service reports. Additionally, cooling tower controllers and building management systems can be programmed with alarms to notify operators if key control parameters like conductivity deviate from the narrow control range.
Of course, all systems are different, and due diligence is necessary to determine the feasibility for utilizing these methods. Always consult your equipment manuals and guides.
Sustainability Assessment
Want to know where you can make the most impact in improving WUE? ChemTreat is offering a free sustainability assessment and report to help you identify where and how you’re using water. We can also provide key recommendations to help you achieve your water and energy savings goals. Click the link below to claim your free audit!
*Based on calculations made in ChemTreat’s CTVista®+ Cooling Configurator and Calculator
The post Data Center Efficiency and Sustainability Part 1: Reducing Excessive Water Usage appeared first on ChemTreat, Inc..
]]>The post Six Ways to Optimize Your Plant’s Pretreatment appeared first on ChemTreat, Inc..
]]>Pretreatment is a broad term used to describe any piece of equipment, chemical, or process used to treat industrial water prior to using it for another purpose. If you have a reverse osmosis (RO) unit, you may need filters upstream to remove suspended solids. If you have boilers, contaminants such as hardness and suspended solids will need to be removed. Water that needs to be discharged from a plant can also require a form of pretreatment before it can be disposed.
Why is Pretreatment Important?
Unfortunately, you can’t just send city water straight to a boiler or discharge wastewater straight into the city’s water supply. This could cause scaling and/or deposition of suspended solids, which can plug up tubes. This may, in turn, require you to feed more chemical, perform more cleanings, and replace your equipment more frequently.
Depending on your system needs, pretreatment systems can get very complex.
Water Sources
When it comes to RO units, there are two different categories of water to consider:
- Brackish water: less than 15,000 total dissolved solids
- Sea water: more than 15,000 total dissolved solids
Total dissolved solids (TDS) are not the only defining factor, however. It is also important to distinguish between surface water, ground/well water, and tertiary/reuse water.
- Surface water: higher concentration of bacteria, suspended solids, dirt, and grit as well as fluctuations in temperature and chemistry based on local weather patterns
- Ground/well water: higher alkalinity, hardness, and potentially iron because this water travels through limestone underground
- Tertiary/reuse water: higher in TDS, total suspended solids (TSS), dissolved metals, and bacteria nutrients like phosphate and nitrogen compounds because this water has likely already been used by the city or plant itself.
Each of these water sources will require different types of pretreatment.
Treating RO Feedwater
Two of the biggest concerns when getting water ready to feed for an RO unit are removing suspended solids down to an acceptable silt density index (SDI) limit and treating the water for bacteria. The RO unit can tolerate a broad range of inorganics, but when levels of heavy metals exceed 0.05 ppm, these will need to be removed prior to the RO.
The makeup of the water can change, so designing a treatment program can pose challenges. Even if you have a well water source with a consistent conductivity rate, the hardness and alkalinity levels can change over time. It is very important to use the most recent water samples as well as more than one sample over a period of time whenever possible when designing a treatment program to ensure you have the right data to make a decision. Many plants neglect any form of SDI or bacteria testing when designing a pretreatment plant, which can negatively impact RO units.
Negative Effects of Poor Pretreatment
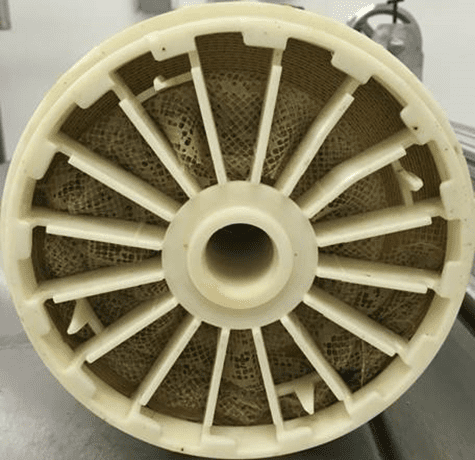
This picture illustrates the negative effects of poor pretreatment. Poor pretreatment can adversely affect your equipment both upstream and downstream.
Six Tips for Optimizing Your Pretreatment
1. Maximize Softener Salt Efficiency
Softeners remove hardness and any other dissolved ions with a positive charge higher than sodium, including some potassium, iron, and heavy metals. It can also act as physical filter and remove some TSS, even though they are not typically designed to do this in the pretreatment process. Everything else passes through the softener.
When the softener exhausts its sodium, the beads need to be recharged with sodium chloride brine.
Three things to look at when determining resin capacity:
- Pounds of salt added per cubic foot
- Cubic foot of resin in vessel
- Total hardness in the water going to the softener
As more salt is added during regeneration, capacity will increase.
lbs. of salt ÷ Kgr/ft3 for capacity = salt efficiency
The increase in capacity is not linear, and you will see a break point for how much salt to use and how much capacity you will get out of that. The ChemTreat team is well-versed in these calculations and can actively work with you to help you optimize your systems.
Be mindful of sodium leakage: the less salt you use during regeneration, the more likely that hardness will leak through.
Many facilities will set their softener regeneration on a timer, but this may not be the best way to achieve water and salt savings. It is important to ensure you are taking control of your system to prevent wasting resources. Also, keep in mind that if your plant has discharge limitations, you may not be able to easily discharge the excess chlorides from the salt, which makes minimizing regenerations even more crucial. It is important to rely on the data and not regenerate the softener unless the sodium is exhausted.
2. Increase RO Recovery
You may think closing the concentrate valve is enough to operate at a higher RO recovery. However, increasing RO recovery tends to be a little more complicated.
Pay attention to your SDI and ensure chemical feeds are correct. Backwashing your upstream ultrafilters or multimedia filters regularly is another important factor to keep in mind. If you are designing a new RO plant, it is vital to consider these issues when looking to increase RO production.
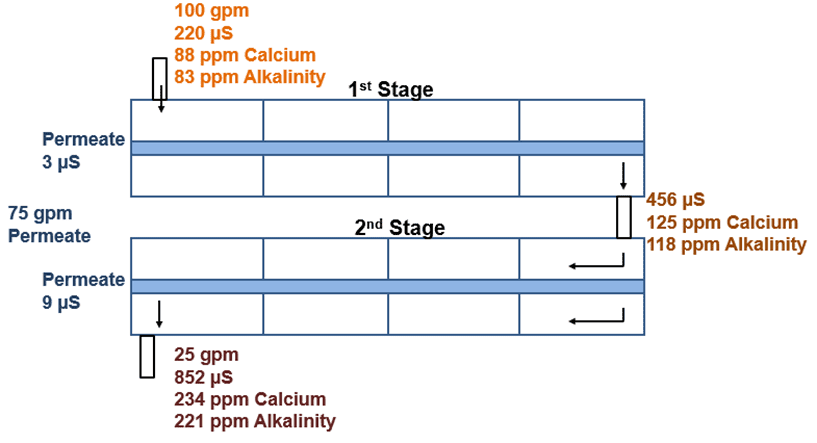
As this diagram illustrates, if we have 100 gpm coming into an RO unit and are operating at 75% recovery, we are creating 75 gpm of filtered water (permeate) and 25 gallons per minute are going down the drain. This is the standard recovery rate that almost all traditional RO systems have been designed around in the past.
However, this rate of water usage is not very efficient, especially if you are focusing on sustainability at your facility. As environmental, social, and governance (ESG) practices around water conservation become more and more prevalent across most industries, 75% RO unit recovery is no longer an acceptable recovery rate for many facilities.
Many of our customers have asked for help retrofitting designs to higher recoveries, installing recovery RO units, and dealing with new technologies like the closed-circuit reverse osmosis (CCRO), which can increase recovery to 90%+.
When looking to increase recovery, it is important to consider scaling potential, ionic loading, and hydraulics.
Difference Between Water Costs for Different Recovery Rates for 100 gpm Feed
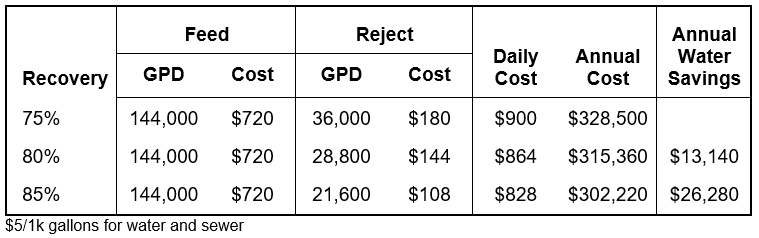
In this example, increasing the recovery rate from 75% to 80% saves $13k in water costs alone. Although the capacity of each facility varies, this shows the potential cost savings you may be able to achieve by increasing RO recovery.
However, before these savings can be realized, it is important to evaluate ionic loading by looking at your water analysis.
Concentration Factor
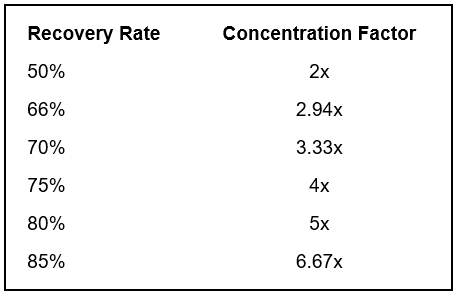
Relationship between RO system recovery rate and the concentration factor of TDS
There is a concentration factor associated with each recovery rate. Whatever enters the RO should concentrate up and leave the unit in the reject stream based on the concentration factor. As the rate increases, so does the amount of TDS being cycled up. If you are running at 3 cycles of concentration at approximately 66% recovery and you want to increase to 4 cycles, the recovery will increase to 75%, a 9% boost at only 1 extra cycle. But if you want to increase from 4 to 5 cycles, the recovery rate only increases by 5% while more stress is added to the system. 90% recovery means going up to 10 cycles. So, if there is 10 ppm of hardness coming in, 100 ppm of hardness will leave the system at 90% recovery.
The higher the recovery rate, the more you need to pay attention to even minor fluctuations in the feedwater quality, as they may cause scaling issues.
Ionic Loading
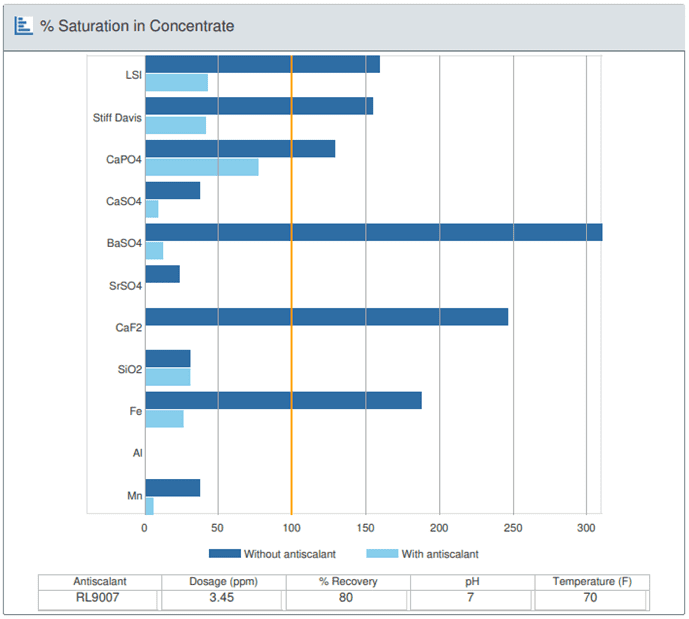
Example from ChemTreat’s RO Configurator, which measures scale saturation levels under certain conditions to provide antiscalant product and dosage recommendations
As this chart indicates, scale should not form if the concentrate saturation is under 100%. Whenever you are looking to increase recovery rates, a new scaling projection should be performed to make sure the antiscalant can handle the new load at the specified pH and temperature. This can also help you calculate how much acid to feed to maintain a new pH target, if necessary, and determine whether the cost of the acid will be less than the projected water cost savings.
Hydraulic Limitations
Hydraulic limitations often get overlooked, and not just when ROs are being retrofitted or recovery is being increased. Our staff has seen many instances of RO systems with a concentrate flow of approximately 4 gallons per minute, when the bare minimum flow for an 8-inch membrane is 12 gallons per minute. Operating like this will create a scaling situation that an ionic projection would not catch or predict.
No matter how much these facilities are controlling their antiscalant and recovery rates, they are still putting their systems at risk of scaling. If the design projection shows the hydraulic limits are outside their design guidelines, scale may form.
Every membrane manufacturer offers a free download of their software for hydraulic evaluation, which points out considerations like the maximum feed flow for various elements, maximum flux rates, etc. An RO unit that uses ultrafiltration as a pretreatment step may be pushed a bit higher from a flux standpoint, whereas a unit using solely a multimedia filter may be more susceptible to suspended solids fouling and therefore more limited from a flux standpoint. The better your pretreatment, the better the flux rates, which means less water going down the drain.
If you are looking to increase the recovery of your unit and conserve water, we recommend running a design projection (or asking your water treatment provider to do so) to better understand your hydraulic limitations on top of the normal scaling projections commonly run when making these decisions.
Reusing RO Reject to Improve Sustainability
There are multiple ways to reuse RO reject in other parts of your system. Some facilities add it to their cooling towers, especially in bigger cooling systems where it can be diluted alongside normal tower makeup water.
RO reject can also be used as rinse water for certain equipment at your plant, as long as it fits the criteria.
There may be other areas where RO reject can be used. You can do a water balance of your system to evaluate potential opportunities.
3. Trend Pressure Drops (dP) Across Individual Stages
Trending pressure drops across the individual stages of your RO system involves adding pressure gauges between the stages, as illustrated in red on the below diagram.
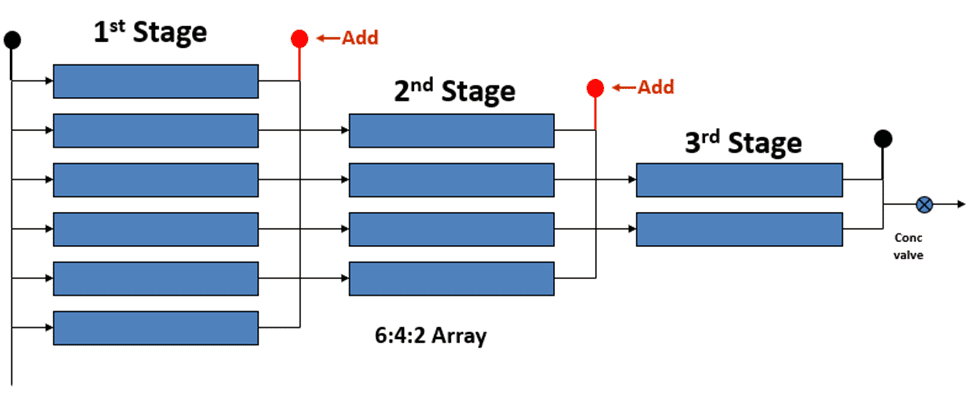
The individual stages refer to the pressure vessels sharing the same feedwater.
Raw feedwater will always hit the vessels in the first stage. These vessels will filter out some water, and the water that does not get pushed through the membrane can be sent to the second stage to increase recovery and so on.
First Stage
The first stage is what typically gets fouled with microbiological, colloidal, organic, and suspended matter (physical fouling). If your pretreatment is stressed and your SDI is high, the first stage will be hit hardest. This means dirt, grit, bacteria, etc. are going to get trapped in those first elements.
It is often recommended to install interstage pressure gauges so you can identify where an issue is happening. Otherwise, when it comes time to troubleshoot, you will need to clean the entire system with multiple products instead of just a portion of it.
Last Stage
The last stage is where scaling may show up. If the recovery is increased or antiscalant feed is lost, the potential for scaling increases. Since the last stage has feedwater with the highest conductivity, this is where scale will initially show up.
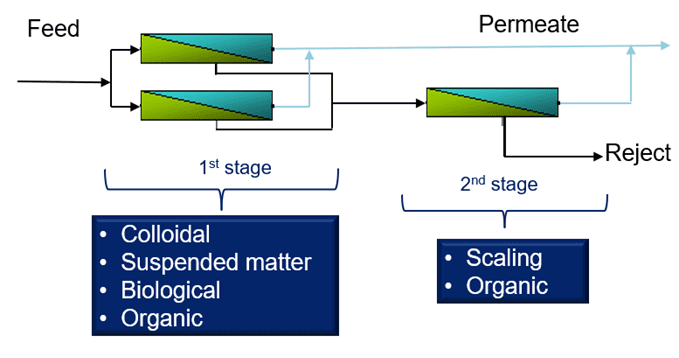
This chart breaks down many of the key issues that affect different stages. Trending pressure drops separately by stage can help you perform more efficient cleanings on your system, reducing chemical and water usage and manpower requirements.
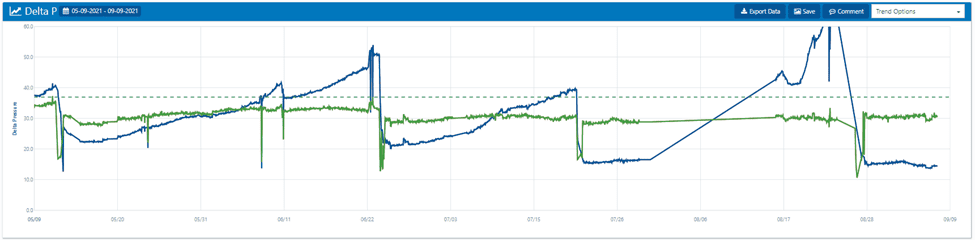
Example of trending pressure drops across different stages
Blue: 1st stage dP
Green: 2nd stage dP
4. Normalize Your Data
Temperature
Many factors affect the function of your RO unit, including temperature. Colder water is denser, which means it requires higher pumping pressures to make the same amount of water as warmer temperatures. The FilmTec Reverse Osmosis Membranes Technical Manual specifically states that a feedwater temperature drop of 7°F (4°C) will cause a permeate flow decrease of approximately 10% (DuPont, 2022, p. 140).
Salinity
As water gets colder, permeate quality may improve because the pores get tighter, reducing salt passage. The inverse is true as the water warms.
Collecting Data for Efficient Cleanings
Like trending pressure drops, collecting temperature, pressure, flow, and salinity data is important to ensure efficient cleanings. If data is normalized, a fouling issue can be distinguished from a change in operation based on temperature fluctuations. This will help you save chemical, water, and manpower when it comes to performing clean-in-place (CIP) procedures.
There are many trending tools available for data normalization. ChemTreat offers this capability as part of CTVista®+, our intelligent water management software. Using automated software means less time spent sorting through raw data and improved data analysis for effective and informed decision-making.
If you see a 10–15% change in your normalized permeate flow, it may be time for a cleaning. Waiting too long before cleaning may impact the health of your RO membranes and even cause mechanical damage, so it is important to use your normalized data as a reference point. Your cleaning schedule will vary based on what kind of water you use and what contaminants are entering your system, so using a standard or preventative maintenance approach can cause you to fall behind on cleanings and lead to premature membrane replacement.
5. Improve Cleaning Practices
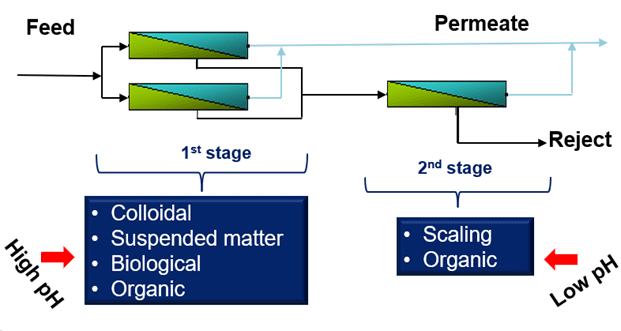
Since foulants vary by stage, different types of cleaners are needed for the different stages.
High-pH Cleaning Process
High-pH cleaners provide good results when targeting suspended matter, bacteria, and organics that tend to show up in the first stage.
The steps below provide a general overview of the cleaning process. However, it is crucial to follow the membrane manufacturer guidelines closely.
1. Prepare X%* solution of high-pH cleaner at a pH of 11.8–12.0 and a temperature of 100°F
2. Flush first 20% of solution through membranes to the drain
3. Circulate and soak remaining solution at 15-minute intervals for 2–3 hours, maintaining pH and temperature (flow for 8-inch membranes is approximately 40 gpm per pressure vessel)
4. Monitor pH levels every 15 minutes and add caustic if a pH decrease of greater than 0.5 is recorded (if you have high organic loading, you may want to flush caustic through your system before the cleaning to clear out some of the heavier fouling; caustic tends to be cheaper than specialty cleaners and adding this step may save you some money as opposed to using two batches of high-pH specialty cleaner)
5. Discard and flush thoroughly with good-quality, chlorine-free water (rinse until permeate pH is 7.5)
*The % solution will depend on the product you are using and the recommendation of your water treatment provider.
Low-pH Cleaning Process
Low-pH cleaners work well for the scaling issues that may arise in the second stage. If you are performing a low-pH cleaning right after a high-pH cleaning, it is important to rinse out the system first to maintain a neutral pH and a permeate conductivity of less than 100.
The procedure for the low-pH cleaning is similar to the high-pH. However, heat is not typically added because the goal is to remove scale.
If your cleaning solution turns a dark, opaque color (high-pH cleaning) or orange and turbid (low-pH cleaning), it needs to be dumped and a new solution started.
Why Can’t I Just Use Caustic?
Boosting the conductivity of your CIP solution with a specialty cleaner can have more benefits than just using surfactants, wetting agents, buffers, etc. For example, if we have a caustic solution with a pH of 12, conductivity is approximately 3,000 µs, which converts to approximately 1,950 ppm of total dissolved solids. For every 100 ppm of TDS, you have one osmotic pressure, so, in this scenario, we have 19.5 psi pushing back against the pump pressure being used for the CIP.
Typical CIP pump pressures operate at approximately 60 psi. By using caustic instead of a specialty cleaner, the pump pressure can overcome the osmotic pressure, making permeate, which is potentially holding down a lot of dirt, grit, and bacteria that you’re trying to get rid of instead of boosting the crossflow, which is the goal of a CIP. Adding a specialty cleaner will increase conductivity to approximately 10,000+ µs, which will boost osmotic loading to over 60 psi and provide a lot of turbulent crossflow to scrape away the foulants.
6. Consider New RO Membrane Technology
Low-Energy Membranes
Low-energy membranes produce the same amount of permeate flow at approximately 150 psi compared to standard membranes, which are tested at approximately 225 psi. This means low-energy membranes produce the same amount of water while using less energy to do so.
This capability means you can use a smaller feed pump to save on operating costs and capital expense. However, if you do design your system around low-energy membranes, it is important not to substitute in standard membranes, as this will cause system issues.
Low-energy membranes significantly reduce pumping energy, which will help you save on operating costs. They also perform better in areas with low feedwater temperatures, though you may see a slightly lower permeate quality.
One example ChemTreat was involved in saved a plant 42% in energy costs by switching to a low-energy RO membrane that only cost $10 more than the standard equivalent.
Closed Circuit Reverse Osmosis (CCRO) and Other High-Recovery RO Units
There are three important factors to consider if you are thinking about installing a CCRO at your facility:
1. Volumetric Recovery
While traditional RO units operate at a constant standard recovery rate, CCROs use volumetric recovery. Standard recovery means that for every minute the unit is running, the same flow of water is being filtered and also sent to drain.
For example, a 100-gpm unit operating at 75% standard recovery sends 75 gallons of water to the filtered water tank and 25 gallons of water to drain every single minute the unit is running.
Volumetric recovery takes time into account. So, for the same 100 gpm unit operating at 75% recovery, the unit is sending 100 gallons of water to the filtered storage tank for approximately 15 minutes and then sending 500 gallons of water to the drain after that time is up. This recovery takes total flow produced / (total flow produced + flow to drain) x 100 to get its recovery.
In the example, 1,500 gallons of water are being produced with 500 gallons going to drain. This means the volumetric recovery would be 1,500/2,000 x 100 = 75% recovery. This is important when designing these systems because cycle time plays a large role in what recoveries can be achieved. If the RO unit cannot run for longer than 15 minutes without shutting off, a recovery higher than 75% cannot be achieved.
When considering recoveries over 90% where cycle times can be 30 minutes or more, make sure there is adequate permeate storage to allow the unit to run this long without interruption.
2. Water Chemistry
Traditional RO systems take scaling and high hydraulic limitations into consideration. For CCRO, you really only need to consider scaling. You will need to work closely with your chemical and equipment providers to make sure you are feeding the right amount of acid to control scale. Verify the information from your equipment company with your water treatment provider so they can select the correct antiscalant and adjust pH if necessary to help meet the specified recovery.
3. Automated Trending
CCROs and other new high-recovery RO units can be very digitized and automated. Unlike with standard ROs, operators may have a hard time monitoring these because they cannot walk up to the system and fill out a log sheet to gather data. Trending CCRO data can be a little tricky, but your water treatment provider can help you gather meaningful metrics from the system.
Final Thoughts: The Importance of Regular Maintenance for Pretreatment
Maintaining your RO system is just as important as its design.
We recommend the following maintenance procedures to improve the life of your system and the quality of your water. Always consult equipment manuals and guides for proper guidance.
- Backwash or change out upstream filters based on pressure drop, not on a timer
- Perform chemical cleanings on your pretreatment filters and/or replace media as needed over the years
- Remember: piping can get just as dirty as filters and RO units, so be mindful of where the issue is really happening
- Inspect systems annually, don’t wait until there is an issue!
Always remember: many factors contribute to the efficiency of your pretreatment and RO systems. As with all other technologies, due diligence is necessary when determining the feasibility of utilizing new methods. Always consult your equipment manuals and guides and reach out to our experienced team for assistance!
References
DuPont. (2022). FilmTec Reverse Osmosis Membranes Technical Manual. Retrieved from: https://www.dupont.com/content/dam/dupont/amer/us/en/water-solutions/public/documents/en/RO-NF-FilmTec-Manual-45-D01504-en.pdf.

The post Six Ways to Optimize Your Plant’s Pretreatment appeared first on ChemTreat, Inc..
]]>The post Three Practices for Sustainable Cooling appeared first on ChemTreat, Inc..
]]>Methods and Considerations for Sustainable Cooling
There are three principal paths to consider when making your cooling system more sustainable:
- Increasing cooling tower cycles of concentration (acid feed pH control)
- Using alternative/non-conventional makeup water sources
- Cascading cooling towers
Increasing Cooling Tower Cycles of Concentration
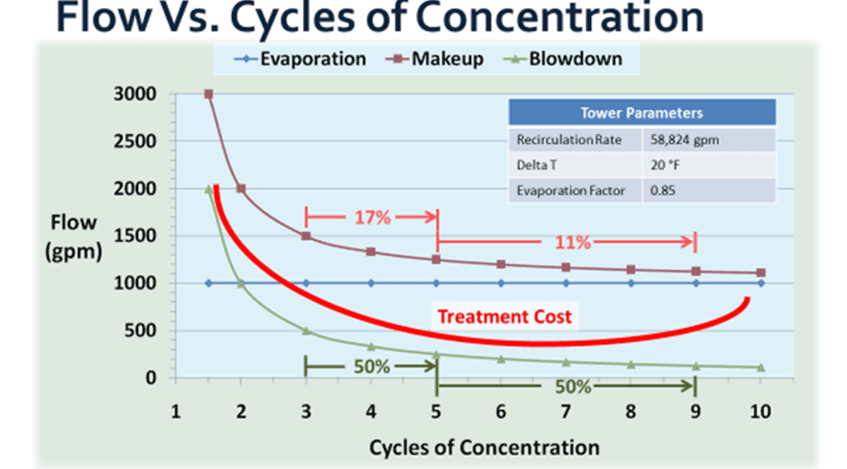
Figure 1 shows that after six or seven cycles of concentration, the water savings potential is small compared to the increase in circulating water contaminant concentrations.
The graph in Figure 1 represents the following equation:
Makeup = Evaporation + Blowdown
Sodium Zeolite Softening
Sodium zeolite softening is one method of increasing cycles of concentration. Reducing calcium and magnesium in the cooling tower makeup stream usually translates to higher cycles if hardness-related scaling saturation indices are the limiting factors (LSI, MgSiO3, CPSI). If another water component, such as chloride, silica, or conductivity/TDS, is the limiting factor, then water softening may not lead to higher cycles of concentration.
To increase cycles of concentration:
- Remove hardness from the makeup water using softeners
- Limit calcium carbonate scale formation
- Replace hardness with sodium
- Hardness is calcium and magnesium (temporary hardness caused by bicarbonates of calcium and magnesium ions)
- Regenerant is salt (sodium chloride)
- Exchange of ions (nothing created or destroyed)
Partial softening via sodium zeolite ion exchange aims to reduce:
- The aggressive/corrosive nature of makeup water
- Regeneration frequency and salt usage
- Dosage concentration of corrosion inhibitor active treatment components
The following factors should be considered before softening:
- Salt delivery cost
- Water used during resin regeneration cycles
- 100% softened makeup water is highly aggressive to low carbon steel piping and cooling tower system components
- Softener upsets will lead to rapid scaling if not detected immediately, as the treatment program is not designed for high scaling potential
As previously mentioned, the incoming makeup water can be partially softened to mitigate the risk of softener upset. Partial softening can be achieved by mixing valves to add raw makeup water to the 100% soft water effluent from the softener. The softening percent is determined by system conditions and desired cycles of concentration.
Acid Feed
Acid feed for control at a specific pH can enhance the performance of inorganic corrosion inhibitors, such as orthophosphate, and maintain their solubilities and overall efficacy.
Reasons for Acid Feed
- Control calcium carbonate (CaCO3) scaling in industrial cooling
- Control calcium phosphate (Ca3(PO4)2) scale (cycles can be increased)
- Help control zinc precipitation
- Improve the effectiveness of chlorine and hypochlorite for microbiological control
- Improve corrosion inhibition with orthophosphate
- Orthophosphate gamma iron oxide film formation is strongest at pH 6.8–7.2
Acid feed can be aggressive to various system materials because it is highly dense. This may cause it to attack the concrete basin floor. Acid feed dilution can help alleviate these challenges.
Benefits of an Acid Dilution System
- Lower cost by reducing acid requirement
- Run at low alkaline pH to reduce corrosion inhibitor requirement
- May need to feed slightly higher scale inhibitor dose, but at threshold concentrations
- Reduce circulating cooling water corrosive potential
Limited pH reduction (low alkaline range) acid feed is comparable to partial water softening.
Alternative/Non-Conventional Makeup Water Sources for Sustainable Cooling
Using the following makeup water sources may help enhance cooling sustainability:
- Gray water (on-site process waste streams)
- Reverse osmosis (RO) permeate
- RO concentrate/reject
- Municipally supplied wastewater
Potential Benefits of Using Gray Water
- Reduce/eliminate demand for municipally supplied water
- Reduce requirement for gray water discharge
- Potentially realize large financial savings, proportional to the size and evaporative heat load placed on the cooling tower system in question
- Cycled PO4 serves as mild steel corrosion inhibitor, and, if high enough, can act anodically in the role of passivator in a neutral pH environment
- Demonstrate responsible environmental stewardship
Gray water usually contains an elevated PO4 component. This means it can serve as a mild steel corrosion treatment component when cycled (benefit). But it may also require higher dose concentrations of dispersant when cycled (challenge).
Potential Challenges of Using Gray Water
- Increased potential for phosphate-related fouling
- Increased polymeric dispersant residual
- May require acid feed for pH control
- Cycled PO4 is a potential microbial nutrient
Potential Benefits of Using Reverse Osmosis Permeate
- Incorporate makeup water largely devoid of all potentially detrimental ionic species
- Eliminate corrosive monovalent anions (chloride) and, by default, divalent ions such as sulfate
- Allow for exceptionally high cooling tower cycling, significantly reducing supply water usage and subsequent cooling tower blowdown (discharge)
- Demonstrate responsible environmental stewardship
Potential Challenges of Using Reverse Osmosis Permeate
- Excess system leakage, cooling tower drift, and windage losses may contribute to unachievable elevated cycles of concentration
- High unit water cost
- More aggressive water requires higher corrosion inhibitor residuals
Potential Benefits of Using Reverse Osmosis Concentrate (Reject)
- Avoid potential wastewater discharge/treatment costs (partial, as there will still be cooling tower blowdown)
- Reduce the quantity of conventionally sourced makeup water to the cooling tower (and associated costs)
- Can be blended with clean water to produce acceptable cooling tower makeup water quality
- Demonstrate responsible environmental stewardship
Potential Challenges of Using Reverse Osmosis Concentrate (Reject)
- RO reject can reduce attainable cycles of concentration if the quantity represents a large percentage of the total makeup water requirement
- Supplied RO reject serving as makeup water is typically cycled four times
- Corrosion rates can rise significantly, depending on the cycled residual concentrations of aggressive anions (chloride and sulfate)
- The cooling tower treatment program will need to incorporate potentially higher active residual concentrations of corrosion inhibitor(s) and dispersants
Potential Benefits of Using Municipal Wastewater
- Likely eliminates the use of conventionally sourced makeup water to the cooling tower and associated costs
- This water is typically disinfected and of fairly good quality as compared to typical city water of potable quality
- May contain elevated PO4 residual concentration, carrying similar benefits observed with gray water
- Demonstrate responsible environmental stewardship
Potential Challenges of Using Municipal Wastewater
- Some detrimental water constituents may be significantly elevated (conductivity, PO4, chloride)
- High PO4 requires increased polymeric dispersant residuals to maintain phosphate solubility
- pH control is typically required
- Automated acid feed system will be required, as discussed earlier
- The cooling tower treatment program will need to incorporate potentially higher active residual concentrations of corrosion inhibitor(s) and dispersants, as well as provision for commodity sulfuric acid
Cascading Cooling Towers for Enhanced Cooling Sustainability
How It Works
A pair of cooling towers are placed in a series. The first cooling tower receives makeup water from the water source used at the facility and is cycled. The second cooling tower uses the first cooling tower’s blowdown as its makeup water source. This limits the achievable cycling degree but may also reduce the overall water usage. The process effectiveness can be determined by the makeup water quality being used by the first cooling tower.
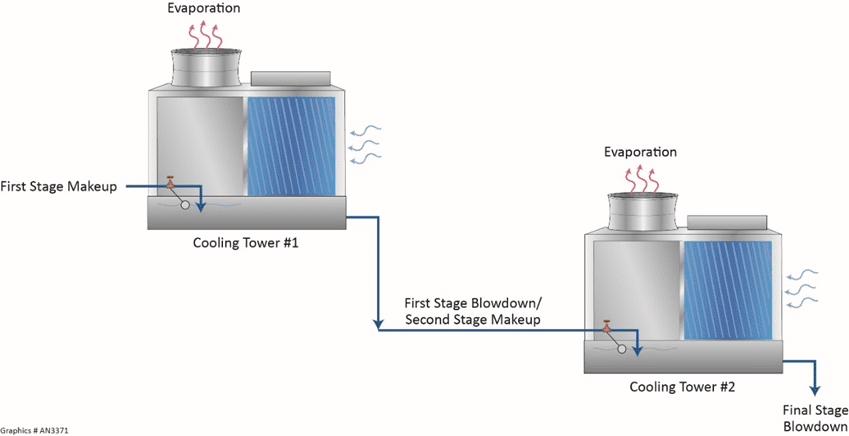
Treatment carryover is key in cascading cooling towers. If the inhibitors remain in their soluble form, they remain usable in the second tower’s treatment program.
Small supplemental chemical additions may be required, especially if higher levels of dispersants or corrosion inhibitors are required. Oxidizing biocides will normally be fed to both cooling towers, and any nonoxidizing biocide from the first tower may be used in the second tower depending on contact time requirements being met.
Cooling Sustainability Summary
Cooling towers offer facilities various techniques for reducing the usage of conventional water sources as makeup. This can help you achieve your environmental goals.
Cooling towers can also serve as an economical means of solids concentration when employing the most effective means of system heat removal.
When evaluating your cooling system for sustainability improvements, the following factors are important to keep in mind:
- Data must be the driving and determining factor when evaluating which options to implement for maximum sustainability and performance reliability
- An honest evaluation considering all factors in the total cost of operation and implementation equation is essential to achieving long-term sustainability goals
As with all other technologies, it is necessary to practice due diligence when determining the feasibility of utilizing methods. Always consult your equipment manuals and guides and reach out to the ChemTreat team for help!

The post Three Practices for Sustainable Cooling appeared first on ChemTreat, Inc..
]]>The post How Do Cooling Towers Work? appeared first on ChemTreat, Inc..
]]>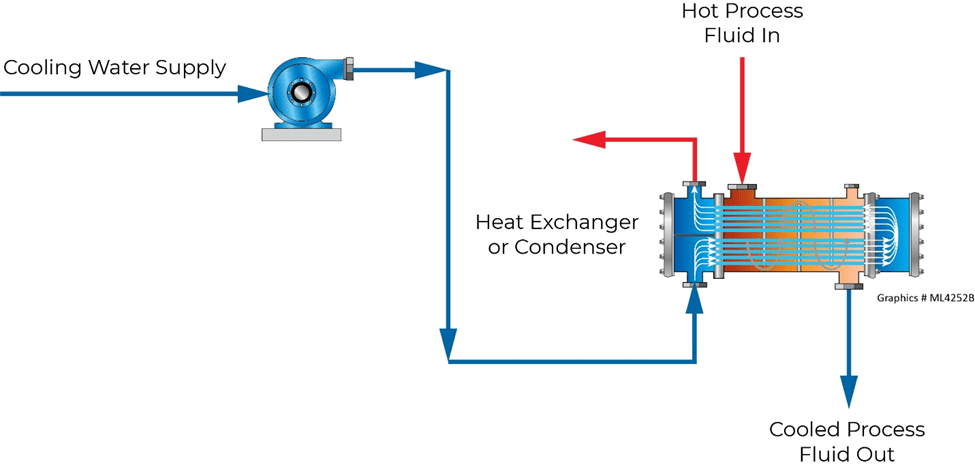
The Fundamentals of How Cooling Towers Work
Cooling towers are specialized heat exchangers that are designed to remove waste heat by creating steam. Their function is to pull heat from the water and return cold water to cool down industrial equipment. In a cooling tower, heat is transferred via sensible heat and latent heat.
- Sensible heat: heat transfer related to changes in water temperature
- Latent heat: heat transfer related to changes in physical state
With cooling towers, most of the heat is transferred to the atmosphere through recirculating cooling water evaporation. Evaporative cooling is frequently used to remove large quantities of heat from processes, equipment, and living spaces. This is shown in the following Heat Transfer Equation:
Q = LHe x m
Where: Q = evaporative heat (heat loss)
LHe = latent heat of vaporization/evaporation of water (Btu/lb.)
m = mass of water
The Role of Water in the Cooling Process
Water is used as the medium in cooling towers. A relatively large quantity of heat is released (1,000 Btu’s) for every pound of water evaporated. When dealing with water, heat transfer is approximately 1,000 times more efficient through evaporation versus sensible heat. The actual value is slightly lower (970.4 Btu’s), but throughout the industry, the 1,000 Btu per pound value is universally accepted.
Cooling towers are designed to create effective heat transfer by connecting air and water in an efficient and expedient manner. Anywhere from 75–95 percent of the heat from the process, equipment, or buildings is removed through evaporation and only 5–25 percent is removed via convection.
The concept of wet bulb and dry bulb temperatures should be considered. Wet bulb temperature is defined as the lowest water temperature at which heat can be removed via evaporation. The lower the wet bulb temperature, the lower the relative humidity, and the more efficient the cooling tower is at heat removal.
Cooling Tower Designs
There are three different tower designs. The right type is determined based on the size of the system/application, geographical location/climate, water quality, and local utility costs.
- Natural draft: large hyperbolic, typically found at power plants
- Cross-flow: induced draft or forced draft
- Counter-flow: induced draft or forced draft
Evaporation
When the recirculating water in a cooling tower evaporates, it theoretically exits as a pure vapor. An extremely small percentage of this vapor carries tiny water droplets containing dissolved solids. This is known as cooling tower drift. At this early point in our discussion, cooling tower drift will be considered out of scope.
Cycles of Concentration
The sequential diagrams in Figure 1 illustrate what we mean by cycles of concentration. As more water is evaporated, the quantity of dissolved solids stays consistent, so their concentration increases.
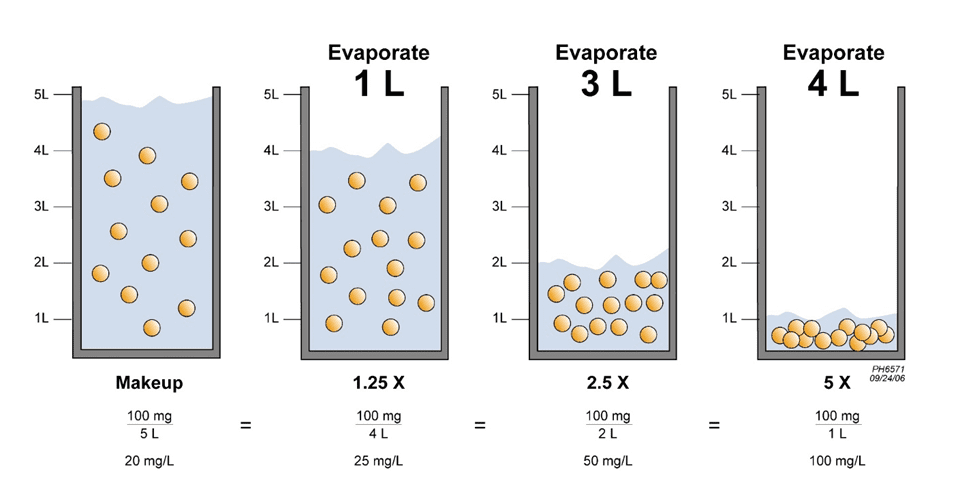
Cooling Tower Approach
- The difference between the cold sump temperature and the wet bulb temperature is called the cooling tower approach.
- The temperature difference between the hot return water and the cold sump water is referred to as the cooling range (ΔT).
Evaporation Equation
The equation in Figure 2 helps determine how much water is being evaporated (E) in terms of gallons per minute.

Note: The term ΔT is the actual measured temperature drop across the tower and not the design temperature.
Cooling Tower Internals
Counter-Flow
Hot return water and air flow are in direct opposition to each other. Drift eliminators introduce a difficult path for water droplets to navigate. Most water droplets cannot find their way to the atmosphere and fall back into the cooling tower basin, leading to decreased annual water consumption.
Splash-Fill
Although it is not considered the most efficient, splash-fill is still used in many applications, including poor quality makeup water or towers serving applications with a high potential for cooling water process contamination. Under these conditions, the higher efficiency fill may foul and require frequent chemical cleanings.
Film-Fill
Film-fill is most frequently used and widely known. It is the familiar PVC-type construction, with the characteristic waffle pattern that spreads the cooling water over a larger surface area for contact with the circulating air flow. Film-fill can be used in applications where the makeup water quality is good and hot return water temperatures never exceed 140°F.
Cooling Tower Mass Balance Calculations
In addition to the equations below, cycles of concentration (COC) can also be calculated by using the ratio of makeup water to blowdown.
Evaporation (gpm)
Recirculation Rate (gpm) x ΔT x Ef / 1,000
Makeup (gpm)
MU = Evap (gpm) x (C/(C-1))
C = cycles of concentration, commonly determined by either:
cooling tower chloride/makeup water chlorides concentration
or
Cooling tower magnesium/makeup water magnesium concentration
Use magnesium if chlorine, hypochlorite, bromine, or chlorine dioxide is used as an oxidizing biocide.
- Blowdown = Makeup – Evaporation (all in gpm)
- Bleed (Intentional Water Loss) = Blowdown – Drift
- Drift = 0.01 to 0.3% for mechanical draft towers
- Drift = 0.3 to 1.0% for natural draft towers
- Half Life (Holding Time Index) (hr.) = 0.693 x V/BD (time to 50% depletion)
- Half Life (hr.) = 2.303 x V/B x Log10 Ci/Cf
- V = System Volume
- BD = Blowdown
- Ci = Initial additive concentration
Cf = Final additive concentration
Choosing the Right Location for Your Cooling Tower
If possible, adhere to the following recommendations when choosing a cooling tower location:
- Do not place near contaminant sources
- Place where sump can be easily cleaned
- Avoid dead legs to reduce potential deposits and corrosion
- Minimize sunlight to reduce potential algae growth
- Add side-stream filters to remove solids (5–7% of flow)
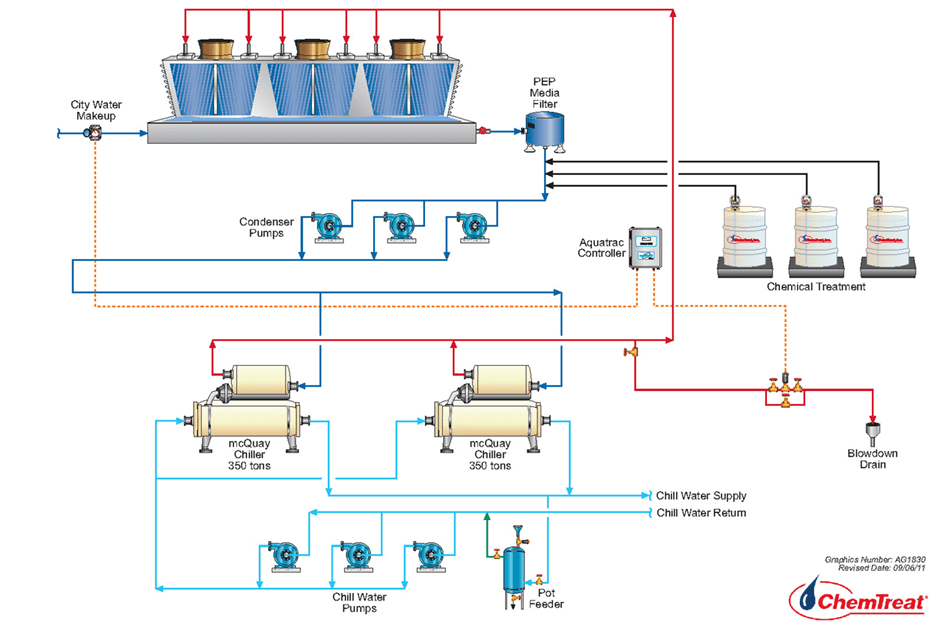
Free-Cooling System
Through manipulation of condenser and chilled water header isolation valves, the system can be set up to have cooling tower water flow bypass the chiller (which is secured/not running) and flow directly through the chilled water piping/coil to the air handler.
The water from the air handler is then returned to the cooling tower to repeat the cycle. Not running the chiller compressor and chilled water loop circulation pumps helps conserve electrical power usage. The required outside ambient air temperature for free cooling is 40–45°F.
General Operational Guidelines
- Maintain flow through off-line equipment or remove it from service properly
- Stop process leaks quickly
- Aim to stay within recommended cooling water treatment control parameters
It’s important to stay vigilant and keep the following in mind:
- Operation
- Water treatment
- Preventive and corrective maintenance (documentation)
- Statistical trending of key performance indicators and testing parameters
- Automated system monitoring, control, and communication
- Well-designed and executed calibration program
Many factors contribute to the efficiency of your cooling system. As with all other technologies, due diligence is necessary when determining the feasibility of utilizing new methods. Always consult your equipment manuals and guides, and don’t forget to contact ChemTreat’s experienced team for assistance!
The post How Do Cooling Towers Work? appeared first on ChemTreat, Inc..
]]>The post Developing a Water Management Plan appeared first on ChemTreat, Inc..
]]>Building water systems have become the subject of continued changes in regulations and best practices in recent years. As building owners and facility managers are challenged to keep up, ChemTreat can be a valued partner in navigating this dynamic environment.
Why is a Water Management Plan Important?
Minimizing the risk of legionellosis associated with building water systems is important for many facilities such as hospitals, hotels, and commercial buildings in meeting water quality safety goals.
The CDC recognizes “many buildings need a water management program to reduce the risk for Legionella growing and spreading within their water system and devices.”*
A well-developed and implemented Water Management Plan can help building owners address Legionella concerns.
Some states now require Water Management Plans. The Centers for Medicare and Medicaid Services, as well as accrediting organizations, require water management programs for participating healthcare facilities.
Six Steps to Develop an Effective Water Management Plan
ChemTreat can offer expert guidance and support to help facilities and healthcare organizations develop ANSI/ASHRAE Standard 188-2021-compliant Water Management Plans.
We can help you:
1. Identify an internal Water Management Plan team
2. Conduct site surveys
3. Generate system descriptions & flow diagrams
4. Establish control measures & corrective actions
5. Create verification & validation procedures
6. Build necessary documentation
Get Expert Support for Your Water Management Plan
While the implementation of a successful Water Management Plan must be driven internally, as your partner, ChemTreat can help you build a comprehensive plan. By trusting in ChemTreat, you gain a partner with a service team that can:
- Help you develop a documented plan.
- Provide the on-site support of a seasoned expert to assess your systems and assist with system sampling and other water treatment needs at your facility
Get in touch with a water treatment expert today for help with your Water Management Plan.
*https://www.cdc.gov/legionella/wmp/toolkit/index.html
The post Developing a Water Management Plan appeared first on ChemTreat, Inc..
]]>The post Best Practices for Water-Cooled Heat Exchanger Cleaning appeared first on ChemTreat, Inc..
]]>Why Is Scale Treatment Important?
Over time, exchangers can accumulate scale that reduces heat transfer. Heat transfer degradation can cost a plant money and may negatively influence process chemistry in some situations. So, it is prudent to have proactive procedures in place to monitor important heat exchanger data and ensure chemical treatment programs are performing effectively.
Even when using proper chemistry, periodic scale removal is often a necessity. Selecting the proper cleaning solution is very important, but frequently not given sufficient consideration.
The most common mineral deposit on the water side of heat exchangers is calcium carbonate (CaCO3). Most raw waters contain significant dissolved concentrations of calcium (Ca2+) and bicarbonate (HCO3–) ions, which, when heated, precipitate as shown in the following equation:
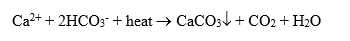
This is also the compound known as lime scale that forms in the hot water piping, faucets, and showerheads of many home plumbing systems.
Removing Scale from Heat Exchangers
Removing calcium carbonate from heat exchangers is relatively straightforward. Because CaCO3 is the salt of weak acid, any solution with even moderate acidity will dissolve the compound.
But this is where those unfamiliar with chemistry often go astray. Our team has directly observed situations where plant operators and technical personnel selected off-the-shelf muriatic acid when preparing cleaning solutions. Muriatic acid is the trade name for hydrochloric acid (HCl), and while it will easily remove calcium carbonate, the chloride ion can cause serious pitting and stress corrosion cracking of stainless steel.
Overfeeding HCl lowers pH, potentially damaging carbon steel piping and other equipment. Repeated use of this solvent can lead to heat exchanger failures.
Higher-grade options such as sulfamic and citric acids may be a much better (and not exorbitantly expensive!) choice. These compounds will remove not only calcium carbonate but also accumulated iron oxides, especially if the solution can be heated to approximately 100°F.
Figure 1. A wheeled cart with tank, tank mixer, and heater for preparation of heat exchanger chemical cleaning solutions. Photo courtesy of Brad Buecker.
Circulating the acid for a few hours (usually for no more than an eight-hour shift) is often satisfactory to remove CaCO3 and iron.
A note of caution: when calcium carbonate reacts with acid, carbon dioxide is released, potentially causing the solution to foam. Monitoring pump operation, particularly at the beginning of the process, is recommended to ensure the pump maintains prime.
In some applications, other deposition may occur. One possibility is calcium sulfate (CaSO4). This compound is the salt of a strong acid, and thus will not dissolve in acids like calcium carbonate will. One method to address issues such as these is chemistry that goes after the cationic portion of the deposit, in this case, the calcium ions. Careful preparation and implementation of cleaning procedures is necessary for minimizing potential corrosion of the base metal.
The Importance of Proper Disposal
In any cleaning process, disposing of the spent solution from the heat exchanger and piping should not be neglected. Simply dumping the material down a plant drain may violate your discharge permit. If possible, we recommend transporting the spent solution to your wastewater treatment facility for proper conditioning prior to discharge.
Please contact ChemTreat for help cleaning your heat exchangers. We have the necessary chemistry and expertise for a successful project and can also recommend chemical treatment programs to proactively reduce scale formation (and microbiological fouling) in cooling water systems.
Like all other technologies, due diligence is necessary to determine the feasibility of utilizing methods. Always consult your equipment manuals and guides!
The post Best Practices for Water-Cooled Heat Exchanger Cleaning appeared first on ChemTreat, Inc..
]]>The post Steam Generator Water/Steam Chemistry Monitoring – Part 6 appeared first on ChemTreat, Inc..
]]>Primary Monitoring Parameters
Contaminant deposition on turbine blades can lead to corrosion and possible blade failures, which represent a potentially catastrophic situation with the turbine spinning at several thousand rpm.
Primary monitoring parameters include the following:
- Sodium: ≤2 parts-per-billion (ppb)
- Conductivity after cation exchange (CACE): ≤0.2 µS/cm
- Silica: ≤10 ppb
Sodium provides a direct indication of salt or sodium hydroxide carryover into steam. Sodium hydroxide (caustic) carryover is a particularly harmful impurity, as it can quickly induce stress corrosion cracking (SCC) of turbine components. Other salts, most notably sodium chloride, will settle in the last rows of the low-pressure (LP) turbine, where they can induce pitting and subsequent SCC and corrosion fatigue (CF) of turbine blades and rotors. Pitting is initiated during unit shutdowns, particularly if humid ambient air enters the condenser and moistens the deposits.
CACE provides a surrogate measurement of chloride and sulfate concentrations, and the ≤0.2 µS/cm limit has been a long-time guideline for turbine manufacturers. However, the accuracy of CACE is suspect, as the steam could have chloride and sulfate levels higher than typical 2 ppb limits, even while CACE stays below the 0.2 µS/cm parameter. Some instrumentation can analyze both impurities at well below 1 ppb concentration.
Silica will precipitate on turbine blades. Though the compound is not corrosive, deposits can influence turbine aerodynamics and reduce efficiency, hence the recommended limit noted above.
Common Steam Sampling Points
Several steam sampling points are common in power generating units. These include saturated, main, and reheat steam samples.
The saturated steam sample provides analyses of impurities coming directly from the boiler drum and can serve as a troubleshooting measurement to detect mechanical carryover. Mechanical carryover can be caused by damage or failure of a steam separating device in the drum.
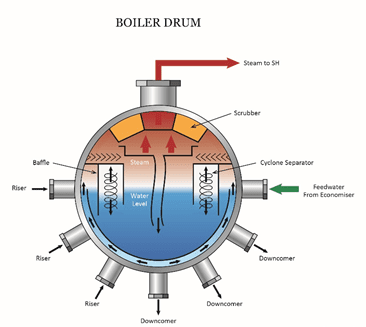
Damage or wear of separating devices allows excessive moisture containing boiler water impurities to enter the steam.
Other factors that can influence mechanical carryover include rapid firing rates or frequent load changes that cause surges in drum water level; inadequate drum size; and boiler water contamination that may generate foam.
Special procedures are required to collect saturated steam to ensure sample integrity. This includes installing an isokinetic sampling nozzle. Major sample panel manufacturers can provide information on the proper methods to ensure integrity of all steam system samples.
Main and reheat steam analyses provide direct data on impurities entering the turbine. Of course, impurity ingress may be coming from drum mechanical carryover, but impurities can also come from contaminated steam attemperation water. Such contamination should also appear in the feedwater samples and thus be detectable at that point. Detection and correction of any mechanism that contaminates feedwater is of great importance, both to protect boiler water and eliminate direct introduction of impurities to steam.
Find the Right Treatment Options for Your Facility
To learn more and request a consultation of your steam generation systems, contact ChemTreat. Our experienced team can help you design a monitoring and treatment programs suited to your plant’s unique needs.
Of course, all systems are different, and due diligence is necessary to determine the feasibility of utilizing methods. Always consult your equipment manuals and guides and seek guidance from a water treatment professional.
The post Steam Generator Water/Steam Chemistry Monitoring – Part 6 appeared first on ChemTreat, Inc..
]]>The post Steam Generator Water/Steam Chemistry Monitoring – Part 5 appeared first on ChemTreat, Inc..
]]>This installment examines recommended monitoring parameters for the boilers in a steam generating system. Factors that influence boiler water treatment include boiler design, boiler/steam pressure, whether the steam is utilized strictly for process heating or for driving turbines, and issues related to condensate return and impurity ingress to the boiler water.
The Importance of Measuring pH
Power plant steam generators generally approach closed loop operation, because the steam only drives a turbine and is then returned in its entirety to the boiler. For the normally small amounts of water/steam that are lost, makeup comes from high-purity treatment systems, which normally ensures clean boiler water.
So, the primary monitoring parameter for utility boiler water is pH. The recommended range may vary slightly depending on the boiler type and operating pressure, but, in general, most guidelines call for a range somewhere between 9.2 and 9.8.
For the numerous units with water-cooled steam condensers, impurity ingress is always a possibility that may cause severe upsets in the high-temperature boiler environment. In these cases, pH becomes the most critical measurement. Virtually all industry guidelines recommend taking a unit off-line immediately if the pH drops to 8.0.
Tri-sodium phosphate (Na3PO4, TSP) in small dosages is still a common way to (temporarily) protect against contaminant ingress until the unit can be shut down. In some cases, small concentrations of caustic (NaOH) may be preferable over TSP.
Note: In the most common type of heat recovery steam generator (HRSG), the feed forward low-pressure (FFLP) design, solid alkalis cannot be utilized for low-pressure evaporator treatment. Rather, pH is controlled via condensate/feedwater ammonia treatment.
Recommended Analyses for High-Pressure Applications
For most high-pressure applications, the following analyses are recommended.
- pH
- Phosphate (for units treated with phosphate)
- Specific conductivity
- Conductivity after cation exchange (CACE)
The conductivity measurements, especially CACE combined with phosphate readings, can be valuable to ensure chemistry is balanced and minimizes corrosion potential. When collected and analyzed by a software program such as ChemTreat’s CTVista®+, this data can provide accurate analyses and trending of boiler water chemistry.
For industrial boilers, additional monitoring may be necessary. In many cases, makeup water treatment may only consist of sodium softening or softening and alkalinity removal. Furthermore, numerous industrial plants have complex steam and condensate return systems that may allow extra impurity ingress to the boilers. Often, the primary impurities are iron oxide corrosion products from the condensate return piping.
Common Treatment Programs for Boiler Water
A common boiler water treatment program for these systems includes phosphate and a polymer, the latter to keep particulates in solution.
If hardness ingress is not an issue, polymer-only programs may be preferable. In either case, determining polymer concentrations can be a challenging task. One method is to blend a trace amount of a fluorescent compound in with the product formulation. The very small quantity of the tracer compound does not interfere with chemical reactions but can be readily analyzed to provide a surrogate measurement of the chemical concentration.
Another possibility, which first gained traction in the cooling water industry a number of years ago, involves tagged polymers. A non-reactive molecule is added to the primary polymers to make them detectable by instrumentation. In cases where tagged polymers are applicable, monitoring is done directly and not by surrogate methods.
As you know, all systems are different. ChemTreat personnel have the knowledge and can supply the products and services to treat any boiler, from very large power boilers to small industrial units. Please contact us for more information. Like all other technologies, due diligence is necessary to determine the feasibility for utilizing methods. Always consult your equipment manuals and guides.
Additional details regarding power boiler sampling may be obtained from the “Technical Guidance Document – 2015 Revision: Instrumentation for monitoring and control of cycle chemistry for the steam-water circuits of fossil-fired and combined cycle power plants”; the International Association for the Properties of Water and Steam (www.iapws.org).
The post Steam Generator Water/Steam Chemistry Monitoring – Part 5 appeared first on ChemTreat, Inc..
]]>